How to work with ERA5 single levels on Earth Data Hub: climatological analysis of temperature in Germany#
Earth Data Hub (EDH) offers an innovative and super-efficient way to access earth related data. This notebook will provide you guidance on how to access and use the ERA5 single levels dataset.
Goal of this tutorial#
The first goal of this tutorial is to compute the 2 metre temperature anomaly for the month of October 2023, in the Germany area, against the 1991-2020 reference period.
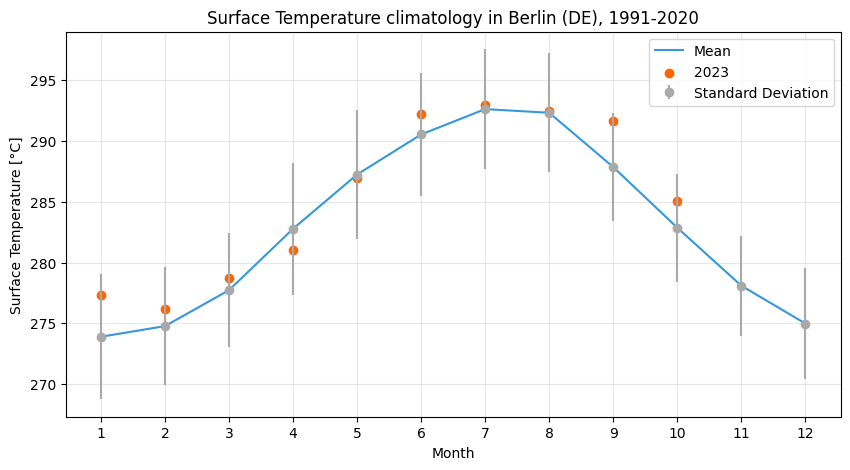
The second goal of this tutorial is to compute the 2 metre temperature climatology (monthly means and standard deviations) in Berlin for the same reference period and compare it with the monthly averages of 2023.
What you will learn:#
how to access the dataset
select and reduce the data
plot the results
To access datasets on Earth Data Hub you need to instruct your tools (xarray, Zarr, etc.) to use EDH personal access token when downloading the data.
To obtain a personal access token you first need to register to the Destination Earth platform. Then you can go to Earth Data Hub account settings where you can find your default personal access token or create others. After retrieving your personal access token, please cut and paste it below: ⤵
[ ]:
PAT = "your_EHD_personal_access_token"

#e.g. PAT="edh_pat_44bbb7e9192a4c6bb47ddf07d07564eee5d17de8dfc48f7118f88e3bc4a4157f8fe2403f5aa0a2d53441b6922ea9a33a"
We will use it later when accessing the dataset.
Working with EDH data#
Datasets on Earth Data Hub are often very large and remotely hosted. Typical use imply a selection of the data followed by one or more reduction steps to be performed in a local or distributed Dask environment.
The structure of a workflow that uses EDH data typically looks like this:
Data access
Data selection
Data reduction (optional)
Data download
Further operations and visualisation
Xarray and Dask work together following a lazy principle. This means that when you access and manipulate a Zarr store the data is in not immediately downloaded and loaded in memory. Instead, Dask constructs a task graph that represents the operations to be performed. A smart user will first reduce the amount of data that needs to be downloaded and explicitly call compute() on it. Once the compute() operation is complete
the data is loaded into memory and available for subsequent fast processing.
1. Data access#
To access the data, only the dataset metadata must be downloaded. Xarray does this automatically when you access a Zarr dataset:
[ ]:
import xarray as xr
xr.set_options(keep_attrs=True)


ds = xr.open_dataset(
    f"https://edh:{PAT}@data.earthdatahub.destine.eu/era5/reanalysis-era5-single-levels-v0.zarr",
    chunks={},
    engine="zarr",
)
ds
<xarray.Dataset> Size: 405TB
Dimensions:     (valid_time: 756768, latitude: 721, longitude: 1440)
Coordinates:
  * valid_time  (valid_time) datetime64[ns] 6MB 1940-01-01 ... 2026-04-30T23:...
  * latitude    (latitude) float64 6kB 90.0 89.75 89.5 ... -89.5 -89.75 -90.0
  * longitude   (longitude) float64 12kB 0.0 0.25 0.5 0.75 ... 359.2 359.5 359.8
    number      int64 8B ...
    surface     float64 8B ...
Data variables: (12/129)
    alnid       (valid_time, latitude, longitude) float32 3TB dask.array<chunksize=(4320, 64, 64), meta=np.ndarray>
    alnip       (valid_time, latitude, longitude) float32 3TB dask.array<chunksize=(4320, 64, 64), meta=np.ndarray>
    aluvd       (valid_time, latitude, longitude) float32 3TB dask.array<chunksize=(4320, 64, 64), meta=np.ndarray>
    aluvp       (valid_time, latitude, longitude) float32 3TB dask.array<chunksize=(4320, 64, 64), meta=np.ndarray>
    anor        (valid_time, latitude, longitude) float32 3TB dask.array<chunksize=(4320, 64, 64), meta=np.ndarray>
    asn         (valid_time, latitude, longitude) float32 3TB dask.array<chunksize=(4320, 64, 64), meta=np.ndarray>
    ...          ...
    viiwn       (valid_time, latitude, longitude) float32 3TB dask.array<chunksize=(4320, 64, 64), meta=np.ndarray>
    vilwd       (valid_time, latitude, longitude) float32 3TB dask.array<chunksize=(4320, 64, 64), meta=np.ndarray>
    vilwe       (valid_time, latitude, longitude) float32 3TB dask.array<chunksize=(4320, 64, 64), meta=np.ndarray>
    vilwn       (valid_time, latitude, longitude) float32 3TB dask.array<chunksize=(4320, 64, 64), meta=np.ndarray>
    z           (valid_time, latitude, longitude) float32 3TB dask.array<chunksize=(4320, 64, 64), meta=np.ndarray>
    zust        (valid_time, latitude, longitude) float32 3TB dask.array<chunksize=(4320, 64, 64), meta=np.ndarray>
Attributes:
    Conventions:             CF-1.7
    GRIB_centre:             ecmf
    GRIB_centreDescription:  European Centre for Medium-Range Weather Forecasts
    GRIB_edition:            1
    GRIB_subCentre:          0
    history:                 2025-12-04T16:25 GRIB to CDM+CF via cfgrib-0.9.1...
institution: European Centre for Medium-Range Weather Forecasts- valid_time: 756768
- latitude: 721
- longitude: 1440
- valid_time(valid_time)datetime64[ns]1940-01-01 ... 2026-04-30T23:00:00
array(['1940-01-01T00:00:00.000000000', '1940-01-01T01:00:00.000000000', '1940-01-01T02:00:00.000000000', ..., '2026-04-30T21:00:00.000000000', '2026-04-30T22:00:00.000000000', '2026-04-30T23:00:00.000000000'], shape=(756768,), dtype='datetime64[ns]') - latitude(latitude)float6490.0 89.75 89.5 ... -89.75 -90.0
- long_name :
- latitude
- standard_name :
- latitude
- stored_direction :
- decreasing
- units :
- degrees_north
array([ 90. , 89.75, 89.5 , ..., -89.5 , -89.75, -90. ], shape=(721,))
- longitude(longitude)float640.0 0.25 0.5 ... 359.2 359.5 359.8
- long_name :
- longitude
- standard_name :
- longitude
- units :
- degrees_east
array([0.0000e+00, 2.5000e-01, 5.0000e-01, ..., 3.5925e+02, 3.5950e+02, 3.5975e+02], shape=(1440,)) - number()int64...
- long_name :
- ensemble member numerical id
- standard_name :
- realization
- units :
- 1
[1 values with dtype=int64]
- surface()float64...
- long_name :
- original GRIB coordinate for key: level(surface)
- units :
- 1
[1 values with dtype=float64]
- alnid(valid_time, latitude, longitude)float32dask.array<chunksize=(4320, 64, 64), meta=np.ndarray>
- GRIB_NV :
- 0
- GRIB_Nx :
- 1440
- GRIB_Ny :
- 721
- GRIB_cfName :
- unknown
- GRIB_cfVarName :
- alnid
- GRIB_dataType :
- an
- GRIB_gridDefinitionDescription :
- Latitude/Longitude Grid
- GRIB_gridType :
- regular_ll
- GRIB_iDirectionIncrementInDegrees :
- 0.25
- GRIB_iScansNegatively :
- 0
- GRIB_jDirectionIncrementInDegrees :
- 0.25
- GRIB_jPointsAreConsecutive :
- 0
- GRIB_jScansPositively :
- 0
- GRIB_latitudeOfFirstGridPointInDegrees :
- 90.0
- GRIB_latitudeOfLastGridPointInDegrees :
- -90.0
- GRIB_longitudeOfFirstGridPointInDegrees :
- 0.0
- GRIB_longitudeOfLastGridPointInDegrees :
- 359.75
- GRIB_missingValue :
- 3.4028234663852886e+38
- GRIB_name :
- Near IR albedo for diffuse radiation (climatological)
- GRIB_numberOfPoints :
- 1038240
- GRIB_paramId :
- 18
- GRIB_shortName :
- alnid
- GRIB_stepType :
- instant
- GRIB_stepUnits :
- 1
- GRIB_totalNumber :
- 0
- GRIB_typeOfLevel :
- surface
- GRIB_units :
- (0 - 1)
- GRIB_uvRelativeToGrid :
- 0
- long_name :
- Near IR albedo for diffuse radiation (climatological)
- standard_name :
- unknown
- units :
- (0 - 1)
Array Chunk Bytes 2.86 TiB 67.50 MiB Shape (756768, 721, 1440) (4320, 64, 64) Dask graph 48576 chunks in 2 graph layers Data type float32 numpy.ndarray - alnip(valid_time, latitude, longitude)float32dask.array<chunksize=(4320, 64, 64), meta=np.ndarray>
- GRIB_NV :
- 0
- GRIB_Nx :
- 1440
- GRIB_Ny :
- 721
- GRIB_cfName :
- unknown
- GRIB_cfVarName :
- alnip
- GRIB_dataType :
- an
- GRIB_gridDefinitionDescription :
- Latitude/Longitude Grid
- GRIB_gridType :
- regular_ll
- GRIB_iDirectionIncrementInDegrees :
- 0.25
- GRIB_iScansNegatively :
- 0
- GRIB_jDirectionIncrementInDegrees :
- 0.25
- GRIB_jPointsAreConsecutive :
- 0
- GRIB_jScansPositively :
- 0
- GRIB_latitudeOfFirstGridPointInDegrees :
- 90.0
- GRIB_latitudeOfLastGridPointInDegrees :
- -90.0
- GRIB_longitudeOfFirstGridPointInDegrees :
- 0.0
- GRIB_longitudeOfLastGridPointInDegrees :
- 359.75
- GRIB_missingValue :
- 3.4028234663852886e+38
- GRIB_name :
- Near IR albedo for direct radiation (climatological)
- GRIB_numberOfPoints :
- 1038240
- GRIB_paramId :
- 17
- GRIB_shortName :
- alnip
- GRIB_stepType :
- instant
- GRIB_stepUnits :
- 1
- GRIB_totalNumber :
- 0
- GRIB_typeOfLevel :
- surface
- GRIB_units :
- (0 - 1)
- GRIB_uvRelativeToGrid :
- 0
- long_name :
- Near IR albedo for direct radiation (climatological)
- standard_name :
- unknown
- units :
- (0 - 1)
Array Chunk Bytes 2.86 TiB 67.50 MiB Shape (756768, 721, 1440) (4320, 64, 64) Dask graph 48576 chunks in 2 graph layers Data type float32 numpy.ndarray - aluvd(valid_time, latitude, longitude)float32dask.array<chunksize=(4320, 64, 64), meta=np.ndarray>
- GRIB_NV :
- 0
- GRIB_Nx :
- 1440
- GRIB_Ny :
- 721
- GRIB_cfName :
- unknown
- GRIB_cfVarName :
- aluvd
- GRIB_dataType :
- an
- GRIB_gridDefinitionDescription :
- Latitude/Longitude Grid
- GRIB_gridType :
- regular_ll
- GRIB_iDirectionIncrementInDegrees :
- 0.25
- GRIB_iScansNegatively :
- 0
- GRIB_jDirectionIncrementInDegrees :
- 0.25
- GRIB_jPointsAreConsecutive :
- 0
- GRIB_jScansPositively :
- 0
- GRIB_latitudeOfFirstGridPointInDegrees :
- 90.0
- GRIB_latitudeOfLastGridPointInDegrees :
- -90.0
- GRIB_longitudeOfFirstGridPointInDegrees :
- 0.0
- GRIB_longitudeOfLastGridPointInDegrees :
- 359.75
- GRIB_missingValue :
- 3.4028234663852886e+38
- GRIB_name :
- UV visible albedo for diffuse radiation (climatological)
- GRIB_numberOfPoints :
- 1038240
- GRIB_paramId :
- 16
- GRIB_shortName :
- aluvd
- GRIB_stepType :
- instant
- GRIB_stepUnits :
- 1
- GRIB_totalNumber :
- 0
- GRIB_typeOfLevel :
- surface
- GRIB_units :
- (0 - 1)
- GRIB_uvRelativeToGrid :
- 0
- long_name :
- UV visible albedo for diffuse radiation (climatological)
- standard_name :
- unknown
- units :
- (0 - 1)
Array Chunk Bytes 2.86 TiB 67.50 MiB Shape (756768, 721, 1440) (4320, 64, 64) Dask graph 48576 chunks in 2 graph layers Data type float32 numpy.ndarray - aluvp(valid_time, latitude, longitude)float32dask.array<chunksize=(4320, 64, 64), meta=np.ndarray>
- GRIB_NV :
- 0
- GRIB_Nx :
- 1440
- GRIB_Ny :
- 721
- GRIB_cfName :
- unknown
- GRIB_cfVarName :
- aluvp
- GRIB_dataType :
- an
- GRIB_gridDefinitionDescription :
- Latitude/Longitude Grid
- GRIB_gridType :
- regular_ll
- GRIB_iDirectionIncrementInDegrees :
- 0.25
- GRIB_iScansNegatively :
- 0
- GRIB_jDirectionIncrementInDegrees :
- 0.25
- GRIB_jPointsAreConsecutive :
- 0
- GRIB_jScansPositively :
- 0
- GRIB_latitudeOfFirstGridPointInDegrees :
- 90.0
- GRIB_latitudeOfLastGridPointInDegrees :
- -90.0
- GRIB_longitudeOfFirstGridPointInDegrees :
- 0.0
- GRIB_longitudeOfLastGridPointInDegrees :
- 359.75
- GRIB_missingValue :
- 3.4028234663852886e+38
- GRIB_name :
- UV visible albedo for direct radiation (climatological)
- GRIB_numberOfPoints :
- 1038240
- GRIB_paramId :
- 15
- GRIB_shortName :
- aluvp
- GRIB_stepType :
- instant
- GRIB_stepUnits :
- 1
- GRIB_totalNumber :
- 0
- GRIB_typeOfLevel :
- surface
- GRIB_units :
- (0 - 1)
- GRIB_uvRelativeToGrid :
- 0
- long_name :
- UV visible albedo for direct radiation (climatological)
- standard_name :
- unknown
- units :
- (0 - 1)
Array Chunk Bytes 2.86 TiB 67.50 MiB Shape (756768, 721, 1440) (4320, 64, 64) Dask graph 48576 chunks in 2 graph layers Data type float32 numpy.ndarray - anor(valid_time, latitude, longitude)float32dask.array<chunksize=(4320, 64, 64), meta=np.ndarray>
- GRIB_NV :
- 0
- GRIB_Nx :
- 1440
- GRIB_Ny :
- 721
- GRIB_cfName :
- unknown
- GRIB_cfVarName :
- anor
- GRIB_dataType :
- an
- GRIB_gridDefinitionDescription :
- Latitude/Longitude Grid
- GRIB_gridType :
- regular_ll
- GRIB_iDirectionIncrementInDegrees :
- 0.25
- GRIB_iScansNegatively :
- 0
- GRIB_jDirectionIncrementInDegrees :
- 0.25
- GRIB_jPointsAreConsecutive :
- 0
- GRIB_jScansPositively :
- 0
- GRIB_latitudeOfFirstGridPointInDegrees :
- 90.0
- GRIB_latitudeOfLastGridPointInDegrees :
- -90.0
- GRIB_longitudeOfFirstGridPointInDegrees :
- 0.0
- GRIB_longitudeOfLastGridPointInDegrees :
- 359.75
- GRIB_missingValue :
- 3.4028234663852886e+38
- GRIB_name :
- Angle of sub-gridscale orography
- GRIB_numberOfPoints :
- 1038240
- GRIB_paramId :
- 162
- GRIB_shortName :
- anor
- GRIB_stepType :
- instant
- GRIB_stepUnits :
- 1
- GRIB_totalNumber :
- 0
- GRIB_typeOfLevel :
- surface
- GRIB_units :
- radians
- GRIB_uvRelativeToGrid :
- 0
- long_name :
- Angle of sub-gridscale orography
- standard_name :
- unknown
- units :
- radians
Array Chunk Bytes 2.86 TiB 67.50 MiB Shape (756768, 721, 1440) (4320, 64, 64) Dask graph 48576 chunks in 2 graph layers Data type float32 numpy.ndarray - asn(valid_time, latitude, longitude)float32dask.array<chunksize=(4320, 64, 64), meta=np.ndarray>
- GRIB_NV :
- 0
- GRIB_Nx :
- 1440
- GRIB_Ny :
- 721
- GRIB_cfName :
- unknown
- GRIB_cfVarName :
- asn
- GRIB_dataType :
- an
- GRIB_gridDefinitionDescription :
- Latitude/Longitude Grid
- GRIB_gridType :
- regular_ll
- GRIB_iDirectionIncrementInDegrees :
- 0.25
- GRIB_iScansNegatively :
- 0
- GRIB_jDirectionIncrementInDegrees :
- 0.25
- GRIB_jPointsAreConsecutive :
- 0
- GRIB_jScansPositively :
- 0
- GRIB_latitudeOfFirstGridPointInDegrees :
- 90.0
- GRIB_latitudeOfLastGridPointInDegrees :
- -90.0
- GRIB_longitudeOfFirstGridPointInDegrees :
- 0.0
- GRIB_longitudeOfLastGridPointInDegrees :
- 359.75
- GRIB_missingValue :
- 3.4028234663852886e+38
- GRIB_name :
- Snow albedo
- GRIB_numberOfPoints :
- 1038240
- GRIB_paramId :
- 32
- GRIB_shortName :
- asn
- GRIB_stepType :
- instant
- GRIB_stepUnits :
- 1
- GRIB_totalNumber :
- 0
- GRIB_typeOfLevel :
- surface
- GRIB_units :
- (0 - 1)
- GRIB_uvRelativeToGrid :
- 0
- long_name :
- Snow albedo
- standard_name :
- unknown
- units :
- (0 - 1)
Array Chunk Bytes 2.86 TiB 67.50 MiB Shape (756768, 721, 1440) (4320, 64, 64) Dask graph 48576 chunks in 2 graph layers Data type float32 numpy.ndarray - bld(valid_time, latitude, longitude)float32dask.array<chunksize=(4320, 64, 64), meta=np.ndarray>
- GRIB_NV :
- 0
- GRIB_Nx :
- 1440
- GRIB_Ny :
- 721
- GRIB_cfName :
- kinetic_energy_dissipation_in_atmosphere_boundary_layer
- GRIB_cfVarName :
- bld
- GRIB_dataType :
- fc
- GRIB_gridDefinitionDescription :
- Latitude/Longitude Grid
- GRIB_gridType :
- regular_ll
- GRIB_iDirectionIncrementInDegrees :
- 0.25
- GRIB_iScansNegatively :
- 0
- GRIB_jDirectionIncrementInDegrees :
- 0.25
- GRIB_jPointsAreConsecutive :
- 0
- GRIB_jScansPositively :
- 0
- GRIB_latitudeOfFirstGridPointInDegrees :
- 90.0
- GRIB_latitudeOfLastGridPointInDegrees :
- -90.0
- GRIB_longitudeOfFirstGridPointInDegrees :
- 0.0
- GRIB_longitudeOfLastGridPointInDegrees :
- 359.75
- GRIB_missingValue :
- 3.4028234663852886e+38
- GRIB_name :
- Time-integrated boundary layer dissipation
- GRIB_numberOfPoints :
- 1038240
- GRIB_paramId :
- 145
- GRIB_shortName :
- bld
- GRIB_stepType :
- accum
- GRIB_stepUnits :
- 1
- GRIB_totalNumber :
- 0
- GRIB_typeOfLevel :
- surface
- GRIB_units :
- J m**-2
- GRIB_uvRelativeToGrid :
- 0
- long_name :
- Time-integrated boundary layer dissipation
- standard_name :
- kinetic_energy_dissipation_in_atmosphere_boundary_layer
- units :
- J m**-2
Array Chunk Bytes 2.86 TiB 67.50 MiB Shape (756768, 721, 1440) (4320, 64, 64) Dask graph 48576 chunks in 2 graph layers Data type float32 numpy.ndarray - blh(valid_time, latitude, longitude)float32dask.array<chunksize=(4320, 64, 64), meta=np.ndarray>
- GRIB_NV :
- 0
- GRIB_Nx :
- 1440
- GRIB_Ny :
- 721
- GRIB_cfName :
- unknown
- GRIB_cfVarName :
- blh
- GRIB_dataType :
- an
- GRIB_gridDefinitionDescription :
- Latitude/Longitude Grid
- GRIB_gridType :
- regular_ll
- GRIB_iDirectionIncrementInDegrees :
- 0.25
- GRIB_iScansNegatively :
- 0
- GRIB_jDirectionIncrementInDegrees :
- 0.25
- GRIB_jPointsAreConsecutive :
- 0
- GRIB_jScansPositively :
- 0
- GRIB_latitudeOfFirstGridPointInDegrees :
- 90.0
- GRIB_latitudeOfLastGridPointInDegrees :
- -90.0
- GRIB_longitudeOfFirstGridPointInDegrees :
- 0.0
- GRIB_longitudeOfLastGridPointInDegrees :
- 359.75
- GRIB_missingValue :
- 3.4028234663852886e+38
- GRIB_name :
- Boundary layer height
- GRIB_numberOfPoints :
- 1038240
- GRIB_paramId :
- 159
- GRIB_shortName :
- blh
- GRIB_stepType :
- instant
- GRIB_stepUnits :
- 1
- GRIB_totalNumber :
- 0
- GRIB_typeOfLevel :
- surface
- GRIB_units :
- m
- GRIB_uvRelativeToGrid :
- 0
- long_name :
- Boundary layer height
- standard_name :
- unknown
- units :
- m
Array Chunk Bytes 2.86 TiB 67.50 MiB Shape (756768, 721, 1440) (4320, 64, 64) Dask graph 48576 chunks in 2 graph layers Data type float32 numpy.ndarray - cape(valid_time, latitude, longitude)float32dask.array<chunksize=(4320, 64, 64), meta=np.ndarray>
- GRIB_NV :
- 0
- GRIB_Nx :
- 1440
- GRIB_Ny :
- 721
- GRIB_cfName :
- unknown
- GRIB_cfVarName :
- cape
- GRIB_dataType :
- an
- GRIB_gridDefinitionDescription :
- Latitude/Longitude Grid
- GRIB_gridType :
- regular_ll
- GRIB_iDirectionIncrementInDegrees :
- 0.25
- GRIB_iScansNegatively :
- 0
- GRIB_jDirectionIncrementInDegrees :
- 0.25
- GRIB_jPointsAreConsecutive :
- 0
- GRIB_jScansPositively :
- 0
- GRIB_latitudeOfFirstGridPointInDegrees :
- 90.0
- GRIB_latitudeOfLastGridPointInDegrees :
- -90.0
- GRIB_longitudeOfFirstGridPointInDegrees :
- 0.0
- GRIB_longitudeOfLastGridPointInDegrees :
- 359.75
- GRIB_missingValue :
- 3.4028234663852886e+38
- GRIB_name :
- Convective available potential energy
- GRIB_numberOfPoints :
- 1038240
- GRIB_paramId :
- 59
- GRIB_shortName :
- cape
- GRIB_stepType :
- instant
- GRIB_stepUnits :
- 1
- GRIB_totalNumber :
- 0
- GRIB_typeOfLevel :
- surface
- GRIB_units :
- J kg**-1
- GRIB_uvRelativeToGrid :
- 0
- long_name :
- Convective available potential energy
- standard_name :
- unknown
- units :
- J kg**-1
Array Chunk Bytes 2.86 TiB 67.50 MiB Shape (756768, 721, 1440) (4320, 64, 64) Dask graph 48576 chunks in 2 graph layers Data type float32 numpy.ndarray - cdir(valid_time, latitude, longitude)float32dask.array<chunksize=(4320, 64, 64), meta=np.ndarray>
- GRIB_NV :
- 0
- GRIB_Nx :
- 1440
- GRIB_Ny :
- 721
- GRIB_cfName :
- unknown
- GRIB_cfVarName :
- cdir
- GRIB_dataType :
- fc
- GRIB_gridDefinitionDescription :
- Latitude/Longitude Grid
- GRIB_gridType :
- regular_ll
- GRIB_iDirectionIncrementInDegrees :
- 0.25
- GRIB_iScansNegatively :
- 0
- GRIB_jDirectionIncrementInDegrees :
- 0.25
- GRIB_jPointsAreConsecutive :
- 0
- GRIB_jScansPositively :
- 0
- GRIB_latitudeOfFirstGridPointInDegrees :
- 90.0
- GRIB_latitudeOfLastGridPointInDegrees :
- -90.0
- GRIB_longitudeOfFirstGridPointInDegrees :
- 0.0
- GRIB_longitudeOfLastGridPointInDegrees :
- 359.75
- GRIB_missingValue :
- 3.4028234663852886e+38
- GRIB_name :
- Surface direct short-wave radiation, clear sky
- GRIB_numberOfPoints :
- 1038240
- GRIB_paramId :
- 228022
- GRIB_shortName :
- cdir
- GRIB_stepType :
- accum
- GRIB_stepUnits :
- 1
- GRIB_totalNumber :
- 0
- GRIB_typeOfLevel :
- surface
- GRIB_units :
- J m**-2
- GRIB_uvRelativeToGrid :
- 0
- long_name :
- Surface direct short-wave radiation, clear sky
- standard_name :
- unknown
- units :
- J m**-2
Array Chunk Bytes 2.86 TiB 67.50 MiB Shape (756768, 721, 1440) (4320, 64, 64) Dask graph 48576 chunks in 2 graph layers Data type float32 numpy.ndarray - chnk(valid_time, latitude, longitude)float32dask.array<chunksize=(4320, 64, 64), meta=np.ndarray>
- GRIB_NV :
- 0
- GRIB_Nx :
- 1440
- GRIB_Ny :
- 721
- GRIB_cfName :
- unknown
- GRIB_cfVarName :
- chnk
- GRIB_dataType :
- an
- GRIB_gridDefinitionDescription :
- Latitude/Longitude Grid
- GRIB_gridType :
- regular_ll
- GRIB_iDirectionIncrementInDegrees :
- 0.25
- GRIB_iScansNegatively :
- 0
- GRIB_jDirectionIncrementInDegrees :
- 0.25
- GRIB_jPointsAreConsecutive :
- 0
- GRIB_jScansPositively :
- 0
- GRIB_latitudeOfFirstGridPointInDegrees :
- 90.0
- GRIB_latitudeOfLastGridPointInDegrees :
- -90.0
- GRIB_longitudeOfFirstGridPointInDegrees :
- 0.0
- GRIB_longitudeOfLastGridPointInDegrees :
- 359.75
- GRIB_missingValue :
- 3.4028234663852886e+38
- GRIB_name :
- Charnock
- GRIB_numberOfPoints :
- 1038240
- GRIB_paramId :
- 148
- GRIB_shortName :
- chnk
- GRIB_stepType :
- instant
- GRIB_stepUnits :
- 1
- GRIB_totalNumber :
- 0
- GRIB_typeOfLevel :
- surface
- GRIB_units :
- Numeric
- GRIB_uvRelativeToGrid :
- 0
- long_name :
- Charnock
- standard_name :
- unknown
- units :
- Numeric
Array Chunk Bytes 2.86 TiB 67.50 MiB Shape (756768, 721, 1440) (4320, 64, 64) Dask graph 48576 chunks in 2 graph layers Data type float32 numpy.ndarray - cin(valid_time, latitude, longitude)float32dask.array<chunksize=(4320, 64, 64), meta=np.ndarray>
- GRIB_NV :
- 0
- GRIB_Nx :
- 1440
- GRIB_Ny :
- 721
- GRIB_cfName :
- unknown
- GRIB_cfVarName :
- cin
- GRIB_dataType :
- fc
- GRIB_gridDefinitionDescription :
- Latitude/Longitude Grid
- GRIB_gridType :
- regular_ll
- GRIB_iDirectionIncrementInDegrees :
- 0.25
- GRIB_iScansNegatively :
- 0
- GRIB_jDirectionIncrementInDegrees :
- 0.25
- GRIB_jPointsAreConsecutive :
- 0
- GRIB_jScansPositively :
- 0
- GRIB_latitudeOfFirstGridPointInDegrees :
- 90.0
- GRIB_latitudeOfLastGridPointInDegrees :
- -90.0
- GRIB_longitudeOfFirstGridPointInDegrees :
- 0.0
- GRIB_longitudeOfLastGridPointInDegrees :
- 359.75
- GRIB_missingValue :
- 3.4028234663852886e+38
- GRIB_name :
- Convective inhibition
- GRIB_numberOfPoints :
- 1038240
- GRIB_paramId :
- 228001
- GRIB_shortName :
- cin
- GRIB_stepType :
- instant
- GRIB_stepUnits :
- 1
- GRIB_totalNumber :
- 0
- GRIB_typeOfLevel :
- surface
- GRIB_units :
- J kg**-1
- GRIB_uvRelativeToGrid :
- 0
- long_name :
- Convective inhibition
- standard_name :
- unknown
- units :
- J kg**-1
Array Chunk Bytes 2.86 TiB 67.50 MiB Shape (756768, 721, 1440) (4320, 64, 64) Dask graph 48576 chunks in 2 graph layers Data type float32 numpy.ndarray - cl(valid_time, latitude, longitude)float32dask.array<chunksize=(4320, 64, 64), meta=np.ndarray>
- GRIB_NV :
- 0
- GRIB_Nx :
- 1440
- GRIB_Ny :
- 721
- GRIB_cfName :
- unknown
- GRIB_cfVarName :
- cl
- GRIB_dataType :
- an
- GRIB_gridDefinitionDescription :
- Latitude/Longitude Grid
- GRIB_gridType :
- regular_ll
- GRIB_iDirectionIncrementInDegrees :
- 0.25
- GRIB_iScansNegatively :
- 0
- GRIB_jDirectionIncrementInDegrees :
- 0.25
- GRIB_jPointsAreConsecutive :
- 0
- GRIB_jScansPositively :
- 0
- GRIB_latitudeOfFirstGridPointInDegrees :
- 90.0
- GRIB_latitudeOfLastGridPointInDegrees :
- -90.0
- GRIB_longitudeOfFirstGridPointInDegrees :
- 0.0
- GRIB_longitudeOfLastGridPointInDegrees :
- 359.75
- GRIB_missingValue :
- 3.4028234663852886e+38
- GRIB_name :
- Lake cover
- GRIB_numberOfPoints :
- 1038240
- GRIB_paramId :
- 26
- GRIB_shortName :
- cl
- GRIB_stepType :
- instant
- GRIB_stepUnits :
- 1
- GRIB_totalNumber :
- 0
- GRIB_typeOfLevel :
- surface
- GRIB_units :
- (0 - 1)
- GRIB_uvRelativeToGrid :
- 0
- long_name :
- Lake cover
- standard_name :
- unknown
- units :
- (0 - 1)
Array Chunk Bytes 2.86 TiB 67.50 MiB Shape (756768, 721, 1440) (4320, 64, 64) Dask graph 48576 chunks in 2 graph layers Data type float32 numpy.ndarray - cp(valid_time, latitude, longitude)float32dask.array<chunksize=(4320, 64, 64), meta=np.ndarray>
- GRIB_NV :
- 0
- GRIB_Nx :
- 1440
- GRIB_Ny :
- 721
- GRIB_cfName :
- lwe_thickness_of_convective_precipitation_amount
- GRIB_cfVarName :
- cp
- GRIB_dataType :
- fc
- GRIB_gridDefinitionDescription :
- Latitude/Longitude Grid
- GRIB_gridType :
- regular_ll
- GRIB_iDirectionIncrementInDegrees :
- 0.25
- GRIB_iScansNegatively :
- 0
- GRIB_jDirectionIncrementInDegrees :
- 0.25
- GRIB_jPointsAreConsecutive :
- 0
- GRIB_jScansPositively :
- 0
- GRIB_latitudeOfFirstGridPointInDegrees :
- 90.0
- GRIB_latitudeOfLastGridPointInDegrees :
- -90.0
- GRIB_longitudeOfFirstGridPointInDegrees :
- 0.0
- GRIB_longitudeOfLastGridPointInDegrees :
- 359.75
- GRIB_missingValue :
- 3.4028234663852886e+38
- GRIB_name :
- Convective precipitation
- GRIB_numberOfPoints :
- 1038240
- GRIB_paramId :
- 143
- GRIB_shortName :
- cp
- GRIB_stepType :
- accum
- GRIB_stepUnits :
- 1
- GRIB_totalNumber :
- 0
- GRIB_typeOfLevel :
- surface
- GRIB_units :
- m
- GRIB_uvRelativeToGrid :
- 0
- long_name :
- Convective precipitation
- standard_name :
- lwe_thickness_of_convective_precipitation_amount
- units :
- m
Array Chunk Bytes 2.86 TiB 67.50 MiB Shape (756768, 721, 1440) (4320, 64, 64) Dask graph 48576 chunks in 2 graph layers Data type float32 numpy.ndarray - crr(valid_time, latitude, longitude)float32dask.array<chunksize=(4320, 64, 64), meta=np.ndarray>
- GRIB_NV :
- 0
- GRIB_Nx :
- 1440
- GRIB_Ny :
- 721
- GRIB_cfName :
- unknown
- GRIB_cfVarName :
- crr
- GRIB_dataType :
- fc
- GRIB_gridDefinitionDescription :
- Latitude/Longitude Grid
- GRIB_gridType :
- regular_ll
- GRIB_iDirectionIncrementInDegrees :
- 0.25
- GRIB_iScansNegatively :
- 0
- GRIB_jDirectionIncrementInDegrees :
- 0.25
- GRIB_jPointsAreConsecutive :
- 0
- GRIB_jScansPositively :
- 0
- GRIB_latitudeOfFirstGridPointInDegrees :
- 90.0
- GRIB_latitudeOfLastGridPointInDegrees :
- -90.0
- GRIB_longitudeOfFirstGridPointInDegrees :
- 0.0
- GRIB_longitudeOfLastGridPointInDegrees :
- 359.75
- GRIB_missingValue :
- 3.4028234663852886e+38
- GRIB_name :
- Convective rain rate
- GRIB_numberOfPoints :
- 1038240
- GRIB_paramId :
- 228218
- GRIB_shortName :
- crr
- GRIB_stepType :
- instant
- GRIB_stepUnits :
- 1
- GRIB_totalNumber :
- 0
- GRIB_typeOfLevel :
- surface
- GRIB_units :
- kg m**-2 s**-1
- GRIB_uvRelativeToGrid :
- 0
- long_name :
- Convective rain rate
- standard_name :
- unknown
- units :
- kg m**-2 s**-1
Array Chunk Bytes 2.86 TiB 67.50 MiB Shape (756768, 721, 1440) (4320, 64, 64) Dask graph 48576 chunks in 2 graph layers Data type float32 numpy.ndarray - csf(valid_time, latitude, longitude)float32dask.array<chunksize=(4320, 64, 64), meta=np.ndarray>
- GRIB_NV :
- 0
- GRIB_Nx :
- 1440
- GRIB_Ny :
- 721
- GRIB_cfName :
- unknown
- GRIB_cfVarName :
- csf
- GRIB_dataType :
- fc
- GRIB_gridDefinitionDescription :
- Latitude/Longitude Grid
- GRIB_gridType :
- regular_ll
- GRIB_iDirectionIncrementInDegrees :
- 0.25
- GRIB_iScansNegatively :
- 0
- GRIB_jDirectionIncrementInDegrees :
- 0.25
- GRIB_jPointsAreConsecutive :
- 0
- GRIB_jScansPositively :
- 0
- GRIB_latitudeOfFirstGridPointInDegrees :
- 90.0
- GRIB_latitudeOfLastGridPointInDegrees :
- -90.0
- GRIB_longitudeOfFirstGridPointInDegrees :
- 0.0
- GRIB_longitudeOfLastGridPointInDegrees :
- 359.75
- GRIB_missingValue :
- 3.4028234663852886e+38
- GRIB_name :
- Convective snowfall
- GRIB_numberOfPoints :
- 1038240
- GRIB_paramId :
- 239
- GRIB_shortName :
- csf
- GRIB_stepType :
- accum
- GRIB_stepUnits :
- 1
- GRIB_totalNumber :
- 0
- GRIB_typeOfLevel :
- surface
- GRIB_units :
- m of water equivalent
- GRIB_uvRelativeToGrid :
- 0
- long_name :
- Convective snowfall
- standard_name :
- unknown
- units :
- m of water equivalent
Array Chunk Bytes 2.86 TiB 67.50 MiB Shape (756768, 721, 1440) (4320, 64, 64) Dask graph 48576 chunks in 2 graph layers Data type float32 numpy.ndarray - csfr(valid_time, latitude, longitude)float32dask.array<chunksize=(4320, 64, 64), meta=np.ndarray>
- GRIB_NV :
- 0
- GRIB_Nx :
- 1440
- GRIB_Ny :
- 721
- GRIB_cfName :
- unknown
- GRIB_cfVarName :
- csfr
- GRIB_dataType :
- fc
- GRIB_gridDefinitionDescription :
- Latitude/Longitude Grid
- GRIB_gridType :
- regular_ll
- GRIB_iDirectionIncrementInDegrees :
- 0.25
- GRIB_iScansNegatively :
- 0
- GRIB_jDirectionIncrementInDegrees :
- 0.25
- GRIB_jPointsAreConsecutive :
- 0
- GRIB_jScansPositively :
- 0
- GRIB_latitudeOfFirstGridPointInDegrees :
- 90.0
- GRIB_latitudeOfLastGridPointInDegrees :
- -90.0
- GRIB_longitudeOfFirstGridPointInDegrees :
- 0.0
- GRIB_longitudeOfLastGridPointInDegrees :
- 359.75
- GRIB_missingValue :
- 3.4028234663852886e+38
- GRIB_name :
- Convective snowfall rate water equivalent
- GRIB_numberOfPoints :
- 1038240
- GRIB_paramId :
- 228220
- GRIB_shortName :
- csfr
- GRIB_stepType :
- instant
- GRIB_stepUnits :
- 1
- GRIB_totalNumber :
- 0
- GRIB_typeOfLevel :
- surface
- GRIB_units :
- kg m**-2 s**-1
- GRIB_uvRelativeToGrid :
- 0
- long_name :
- Convective snowfall rate water equivalent
- standard_name :
- unknown
- units :
- kg m**-2 s**-1
Array Chunk Bytes 2.86 TiB 67.50 MiB Shape (756768, 721, 1440) (4320, 64, 64) Dask graph 48576 chunks in 2 graph layers Data type float32 numpy.ndarray - cvh(valid_time, latitude, longitude)float32dask.array<chunksize=(4320, 64, 64), meta=np.ndarray>
- GRIB_NV :
- 0
- GRIB_Nx :
- 1440
- GRIB_Ny :
- 721
- GRIB_cfName :
- unknown
- GRIB_cfVarName :
- cvh
- GRIB_dataType :
- an
- GRIB_gridDefinitionDescription :
- Latitude/Longitude Grid
- GRIB_gridType :
- regular_ll
- GRIB_iDirectionIncrementInDegrees :
- 0.25
- GRIB_iScansNegatively :
- 0
- GRIB_jDirectionIncrementInDegrees :
- 0.25
- GRIB_jPointsAreConsecutive :
- 0
- GRIB_jScansPositively :
- 0
- GRIB_latitudeOfFirstGridPointInDegrees :
- 90.0
- GRIB_latitudeOfLastGridPointInDegrees :
- -90.0
- GRIB_longitudeOfFirstGridPointInDegrees :
- 0.0
- GRIB_longitudeOfLastGridPointInDegrees :
- 359.75
- GRIB_missingValue :
- 3.4028234663852886e+38
- GRIB_name :
- High vegetation cover
- GRIB_numberOfPoints :
- 1038240
- GRIB_paramId :
- 28
- GRIB_shortName :
- cvh
- GRIB_stepType :
- instant
- GRIB_stepUnits :
- 1
- GRIB_totalNumber :
- 0
- GRIB_typeOfLevel :
- surface
- GRIB_units :
- (0 - 1)
- GRIB_uvRelativeToGrid :
- 0
- long_name :
- High vegetation cover
- standard_name :
- unknown
- units :
- (0 - 1)
Array Chunk Bytes 2.86 TiB 67.50 MiB Shape (756768, 721, 1440) (4320, 64, 64) Dask graph 48576 chunks in 2 graph layers Data type float32 numpy.ndarray - cvl(valid_time, latitude, longitude)float32dask.array<chunksize=(4320, 64, 64), meta=np.ndarray>
- GRIB_NV :
- 0
- GRIB_Nx :
- 1440
- GRIB_Ny :
- 721
- GRIB_cfName :
- unknown
- GRIB_cfVarName :
- cvl
- GRIB_dataType :
- an
- GRIB_gridDefinitionDescription :
- Latitude/Longitude Grid
- GRIB_gridType :
- regular_ll
- GRIB_iDirectionIncrementInDegrees :
- 0.25
- GRIB_iScansNegatively :
- 0
- GRIB_jDirectionIncrementInDegrees :
- 0.25
- GRIB_jPointsAreConsecutive :
- 0
- GRIB_jScansPositively :
- 0
- GRIB_latitudeOfFirstGridPointInDegrees :
- 90.0
- GRIB_latitudeOfLastGridPointInDegrees :
- -90.0
- GRIB_longitudeOfFirstGridPointInDegrees :
- 0.0
- GRIB_longitudeOfLastGridPointInDegrees :
- 359.75
- GRIB_missingValue :
- 3.4028234663852886e+38
- GRIB_name :
- Low vegetation cover
- GRIB_numberOfPoints :
- 1038240
- GRIB_paramId :
- 27
- GRIB_shortName :
- cvl
- GRIB_stepType :
- instant
- GRIB_stepUnits :
- 1
- GRIB_totalNumber :
- 0
- GRIB_typeOfLevel :
- surface
- GRIB_units :
- (0 - 1)
- GRIB_uvRelativeToGrid :
- 0
- long_name :
- Low vegetation cover
- standard_name :
- unknown
- units :
- (0 - 1)
Array Chunk Bytes 2.86 TiB 67.50 MiB Shape (756768, 721, 1440) (4320, 64, 64) Dask graph 48576 chunks in 2 graph layers Data type float32 numpy.ndarray - d2m(valid_time, latitude, longitude)float32dask.array<chunksize=(4320, 64, 64), meta=np.ndarray>
- GRIB_NV :
- 0
- GRIB_Nx :
- 1440
- GRIB_Ny :
- 721
- GRIB_cfName :
- unknown
- GRIB_cfVarName :
- d2m
- GRIB_dataType :
- an
- GRIB_gridDefinitionDescription :
- Latitude/Longitude Grid
- GRIB_gridType :
- regular_ll
- GRIB_iDirectionIncrementInDegrees :
- 0.25
- GRIB_iScansNegatively :
- 0
- GRIB_jDirectionIncrementInDegrees :
- 0.25
- GRIB_jPointsAreConsecutive :
- 0
- GRIB_jScansPositively :
- 0
- GRIB_latitudeOfFirstGridPointInDegrees :
- 90.0
- GRIB_latitudeOfLastGridPointInDegrees :
- -90.0
- GRIB_longitudeOfFirstGridPointInDegrees :
- 0.0
- GRIB_longitudeOfLastGridPointInDegrees :
- 359.75
- GRIB_missingValue :
- 3.4028234663852886e+38
- GRIB_name :
- 2 metre dewpoint temperature
- GRIB_numberOfPoints :
- 1038240
- GRIB_paramId :
- 168
- GRIB_shortName :
- 2d
- GRIB_stepType :
- instant
- GRIB_stepUnits :
- 1
- GRIB_totalNumber :
- 0
- GRIB_typeOfLevel :
- surface
- GRIB_units :
- K
- GRIB_uvRelativeToGrid :
- 0
- long_name :
- 2 metre dewpoint temperature
- standard_name :
- unknown
- units :
- K
Array Chunk Bytes 2.86 TiB 67.50 MiB Shape (756768, 721, 1440) (4320, 64, 64) Dask graph 48576 chunks in 2 graph layers Data type float32 numpy.ndarray - dctb(valid_time, latitude, longitude)float32dask.array<chunksize=(4320, 64, 64), meta=np.ndarray>
- GRIB_NV :
- 0
- GRIB_Nx :
- 1440
- GRIB_Ny :
- 721
- GRIB_cfName :
- unknown
- GRIB_cfVarName :
- dctb
- GRIB_dataType :
- fc
- GRIB_gridDefinitionDescription :
- Latitude/Longitude Grid
- GRIB_gridType :
- regular_ll
- GRIB_iDirectionIncrementInDegrees :
- 0.25
- GRIB_iScansNegatively :
- 0
- GRIB_jDirectionIncrementInDegrees :
- 0.25
- GRIB_jPointsAreConsecutive :
- 0
- GRIB_jScansPositively :
- 0
- GRIB_latitudeOfFirstGridPointInDegrees :
- 90.0
- GRIB_latitudeOfLastGridPointInDegrees :
- -90.0
- GRIB_longitudeOfFirstGridPointInDegrees :
- 0.0
- GRIB_longitudeOfLastGridPointInDegrees :
- 359.75
- GRIB_missingValue :
- 3.4028234663852886e+38
- GRIB_name :
- Duct base height
- GRIB_numberOfPoints :
- 1038240
- GRIB_paramId :
- 228017
- GRIB_shortName :
- dctb
- GRIB_stepType :
- instant
- GRIB_stepUnits :
- 1
- GRIB_totalNumber :
- 0
- GRIB_typeOfLevel :
- surface
- GRIB_units :
- m
- GRIB_uvRelativeToGrid :
- 0
- long_name :
- Duct base height
- standard_name :
- unknown
- units :
- m
Array Chunk Bytes 2.86 TiB 67.50 MiB Shape (756768, 721, 1440) (4320, 64, 64) Dask graph 48576 chunks in 2 graph layers Data type float32 numpy.ndarray - dl(valid_time, latitude, longitude)float32dask.array<chunksize=(4320, 64, 64), meta=np.ndarray>
- GRIB_NV :
- 0
- GRIB_Nx :
- 1440
- GRIB_Ny :
- 721
- GRIB_cfName :
- unknown
- GRIB_cfVarName :
- dl
- GRIB_dataType :
- an
- GRIB_gridDefinitionDescription :
- Latitude/Longitude Grid
- GRIB_gridType :
- regular_ll
- GRIB_iDirectionIncrementInDegrees :
- 0.25
- GRIB_iScansNegatively :
- 0
- GRIB_jDirectionIncrementInDegrees :
- 0.25
- GRIB_jPointsAreConsecutive :
- 0
- GRIB_jScansPositively :
- 0
- GRIB_latitudeOfFirstGridPointInDegrees :
- 90.0
- GRIB_latitudeOfLastGridPointInDegrees :
- -90.0
- GRIB_longitudeOfFirstGridPointInDegrees :
- 0.0
- GRIB_longitudeOfLastGridPointInDegrees :
- 359.75
- GRIB_missingValue :
- 3.4028234663852886e+38
- GRIB_name :
- Lake total depth
- GRIB_numberOfPoints :
- 1038240
- GRIB_paramId :
- 228007
- GRIB_shortName :
- dl
- GRIB_stepType :
- instant
- GRIB_stepUnits :
- 1
- GRIB_totalNumber :
- 0
- GRIB_typeOfLevel :
- surface
- GRIB_units :
- m
- GRIB_uvRelativeToGrid :
- 0
- long_name :
- Lake total depth
- standard_name :
- unknown
- units :
- m
Array Chunk Bytes 2.86 TiB 67.50 MiB Shape (756768, 721, 1440) (4320, 64, 64) Dask graph 48576 chunks in 2 graph layers Data type float32 numpy.ndarray - dndza(valid_time, latitude, longitude)float32dask.array<chunksize=(4320, 64, 64), meta=np.ndarray>
- GRIB_NV :
- 0
- GRIB_Nx :
- 1440
- GRIB_Ny :
- 721
- GRIB_cfName :
- unknown
- GRIB_cfVarName :
- dndza
- GRIB_dataType :
- fc
- GRIB_gridDefinitionDescription :
- Latitude/Longitude Grid
- GRIB_gridType :
- regular_ll
- GRIB_iDirectionIncrementInDegrees :
- 0.25
- GRIB_iScansNegatively :
- 0
- GRIB_jDirectionIncrementInDegrees :
- 0.25
- GRIB_jPointsAreConsecutive :
- 0
- GRIB_jScansPositively :
- 0
- GRIB_latitudeOfFirstGridPointInDegrees :
- 90.0
- GRIB_latitudeOfLastGridPointInDegrees :
- -90.0
- GRIB_longitudeOfFirstGridPointInDegrees :
- 0.0
- GRIB_longitudeOfLastGridPointInDegrees :
- 359.75
- GRIB_missingValue :
- 3.4028234663852886e+38
- GRIB_name :
- Mean vertical gradient of refractivity inside trapping layer
- GRIB_numberOfPoints :
- 1038240
- GRIB_paramId :
- 228016
- GRIB_shortName :
- dndza
- GRIB_stepType :
- instant
- GRIB_stepUnits :
- 1
- GRIB_totalNumber :
- 0
- GRIB_typeOfLevel :
- surface
- GRIB_units :
- m**-1
- GRIB_uvRelativeToGrid :
- 0
- long_name :
- Mean vertical gradient of refractivity inside trapping layer
- standard_name :
- unknown
- units :
- m**-1
Array Chunk Bytes 2.86 TiB 67.50 MiB Shape (756768, 721, 1440) (4320, 64, 64) Dask graph 48576 chunks in 2 graph layers Data type float32 numpy.ndarray - dndzn(valid_time, latitude, longitude)float32dask.array<chunksize=(4320, 64, 64), meta=np.ndarray>
- GRIB_NV :
- 0
- GRIB_Nx :
- 1440
- GRIB_Ny :
- 721
- GRIB_cfName :
- unknown
- GRIB_cfVarName :
- dndzn
- GRIB_dataType :
- fc
- GRIB_gridDefinitionDescription :
- Latitude/Longitude Grid
- GRIB_gridType :
- regular_ll
- GRIB_iDirectionIncrementInDegrees :
- 0.25
- GRIB_iScansNegatively :
- 0
- GRIB_jDirectionIncrementInDegrees :
- 0.25
- GRIB_jPointsAreConsecutive :
- 0
- GRIB_jScansPositively :
- 0
- GRIB_latitudeOfFirstGridPointInDegrees :
- 90.0
- GRIB_latitudeOfLastGridPointInDegrees :
- -90.0
- GRIB_longitudeOfFirstGridPointInDegrees :
- 0.0
- GRIB_longitudeOfLastGridPointInDegrees :
- 359.75
- GRIB_missingValue :
- 3.4028234663852886e+38
- GRIB_name :
- Minimum vertical gradient of refractivity inside trapping layer
- GRIB_numberOfPoints :
- 1038240
- GRIB_paramId :
- 228015
- GRIB_shortName :
- dndzn
- GRIB_stepType :
- instant
- GRIB_stepUnits :
- 1
- GRIB_totalNumber :
- 0
- GRIB_typeOfLevel :
- surface
- GRIB_units :
- m**-1
- GRIB_uvRelativeToGrid :
- 0
- long_name :
- Minimum vertical gradient of refractivity inside trapping layer
- standard_name :
- unknown
- units :
- m**-1
Array Chunk Bytes 2.86 TiB 67.50 MiB Shape (756768, 721, 1440) (4320, 64, 64) Dask graph 48576 chunks in 2 graph layers Data type float32 numpy.ndarray - e(valid_time, latitude, longitude)float32dask.array<chunksize=(4320, 64, 64), meta=np.ndarray>
- GRIB_NV :
- 0
- GRIB_Nx :
- 1440
- GRIB_Ny :
- 721
- GRIB_cfName :
- lwe_thickness_of_water_evaporation_amount
- GRIB_cfVarName :
- e
- GRIB_dataType :
- fc
- GRIB_gridDefinitionDescription :
- Latitude/Longitude Grid
- GRIB_gridType :
- regular_ll
- GRIB_iDirectionIncrementInDegrees :
- 0.25
- GRIB_iScansNegatively :
- 0
- GRIB_jDirectionIncrementInDegrees :
- 0.25
- GRIB_jPointsAreConsecutive :
- 0
- GRIB_jScansPositively :
- 0
- GRIB_latitudeOfFirstGridPointInDegrees :
- 90.0
- GRIB_latitudeOfLastGridPointInDegrees :
- -90.0
- GRIB_longitudeOfFirstGridPointInDegrees :
- 0.0
- GRIB_longitudeOfLastGridPointInDegrees :
- 359.75
- GRIB_missingValue :
- 3.4028234663852886e+38
- GRIB_name :
- Evaporation
- GRIB_numberOfPoints :
- 1038240
- GRIB_paramId :
- 182
- GRIB_shortName :
- e
- GRIB_stepType :
- accum
- GRIB_stepUnits :
- 1
- GRIB_totalNumber :
- 0
- GRIB_typeOfLevel :
- surface
- GRIB_units :
- m of water equivalent
- GRIB_uvRelativeToGrid :
- 0
- long_name :
- Evaporation
- standard_name :
- lwe_thickness_of_water_evaporation_amount
- units :
- m of water equivalent
Array Chunk Bytes 2.86 TiB 67.50 MiB Shape (756768, 721, 1440) (4320, 64, 64) Dask graph 48576 chunks in 2 graph layers Data type float32 numpy.ndarray - es(valid_time, latitude, longitude)float32dask.array<chunksize=(4320, 64, 64), meta=np.ndarray>
- GRIB_NV :
- 0
- GRIB_Nx :
- 1440
- GRIB_Ny :
- 721
- GRIB_cfName :
- unknown
- GRIB_cfVarName :
- es
- GRIB_dataType :
- fc
- GRIB_gridDefinitionDescription :
- Latitude/Longitude Grid
- GRIB_gridType :
- regular_ll
- GRIB_iDirectionIncrementInDegrees :
- 0.25
- GRIB_iScansNegatively :
- 0
- GRIB_jDirectionIncrementInDegrees :
- 0.25
- GRIB_jPointsAreConsecutive :
- 0
- GRIB_jScansPositively :
- 0
- GRIB_latitudeOfFirstGridPointInDegrees :
- 90.0
- GRIB_latitudeOfLastGridPointInDegrees :
- -90.0
- GRIB_longitudeOfFirstGridPointInDegrees :
- 0.0
- GRIB_longitudeOfLastGridPointInDegrees :
- 359.75
- GRIB_missingValue :
- 3.4028234663852886e+38
- GRIB_name :
- Snow evaporation
- GRIB_numberOfPoints :
- 1038240
- GRIB_paramId :
- 44
- GRIB_shortName :
- es
- GRIB_stepType :
- accum
- GRIB_stepUnits :
- 1
- GRIB_totalNumber :
- 0
- GRIB_typeOfLevel :
- surface
- GRIB_units :
- m of water equivalent
- GRIB_uvRelativeToGrid :
- 0
- long_name :
- Snow evaporation
- standard_name :
- unknown
- units :
- m of water equivalent
Array Chunk Bytes 2.86 TiB 67.50 MiB Shape (756768, 721, 1440) (4320, 64, 64) Dask graph 48576 chunks in 2 graph layers Data type float32 numpy.ndarray - ewss(valid_time, latitude, longitude)float32dask.array<chunksize=(4320, 64, 64), meta=np.ndarray>
- GRIB_NV :
- 0
- GRIB_Nx :
- 1440
- GRIB_Ny :
- 721
- GRIB_cfName :
- surface_downward_eastward_stress
- GRIB_cfVarName :
- ewss
- GRIB_dataType :
- fc
- GRIB_gridDefinitionDescription :
- Latitude/Longitude Grid
- GRIB_gridType :
- regular_ll
- GRIB_iDirectionIncrementInDegrees :
- 0.25
- GRIB_iScansNegatively :
- 0
- GRIB_jDirectionIncrementInDegrees :
- 0.25
- GRIB_jPointsAreConsecutive :
- 0
- GRIB_jScansPositively :
- 0
- GRIB_latitudeOfFirstGridPointInDegrees :
- 90.0
- GRIB_latitudeOfLastGridPointInDegrees :
- -90.0
- GRIB_longitudeOfFirstGridPointInDegrees :
- 0.0
- GRIB_longitudeOfLastGridPointInDegrees :
- 359.75
- GRIB_missingValue :
- 3.4028234663852886e+38
- GRIB_name :
- Time-integrated eastward turbulent surface stress
- GRIB_numberOfPoints :
- 1038240
- GRIB_paramId :
- 180
- GRIB_shortName :
- ewss
- GRIB_stepType :
- accum
- GRIB_stepUnits :
- 1
- GRIB_totalNumber :
- 0
- GRIB_typeOfLevel :
- surface
- GRIB_units :
- N m**-2 s
- GRIB_uvRelativeToGrid :
- 0
- long_name :
- Time-integrated eastward turbulent surface stress
- standard_name :
- surface_downward_eastward_stress
- units :
- N m**-2 s
Array Chunk Bytes 2.86 TiB 67.50 MiB Shape (756768, 721, 1440) (4320, 64, 64) Dask graph 48576 chunks in 2 graph layers Data type float32 numpy.ndarray - fal(valid_time, latitude, longitude)float32dask.array<chunksize=(4320, 64, 64), meta=np.ndarray>
- GRIB_NV :
- 0
- GRIB_Nx :
- 1440
- GRIB_Ny :
- 721
- GRIB_cfName :
- unknown
- GRIB_cfVarName :
- fal
- GRIB_dataType :
- an
- GRIB_gridDefinitionDescription :
- Latitude/Longitude Grid
- GRIB_gridType :
- regular_ll
- GRIB_iDirectionIncrementInDegrees :
- 0.25
- GRIB_iScansNegatively :
- 0
- GRIB_jDirectionIncrementInDegrees :
- 0.25
- GRIB_jPointsAreConsecutive :
- 0
- GRIB_jScansPositively :
- 0
- GRIB_latitudeOfFirstGridPointInDegrees :
- 90.0
- GRIB_latitudeOfLastGridPointInDegrees :
- -90.0
- GRIB_longitudeOfFirstGridPointInDegrees :
- 0.0
- GRIB_longitudeOfLastGridPointInDegrees :
- 359.75
- GRIB_missingValue :
- 3.4028234663852886e+38
- GRIB_name :
- Forecast albedo
- GRIB_numberOfPoints :
- 1038240
- GRIB_paramId :
- 243
- GRIB_shortName :
- fal
- GRIB_stepType :
- instant
- GRIB_stepUnits :
- 1
- GRIB_totalNumber :
- 0
- GRIB_typeOfLevel :
- surface
- GRIB_units :
- (0 - 1)
- GRIB_uvRelativeToGrid :
- 0
- long_name :
- Forecast albedo
- standard_name :
- unknown
- units :
- (0 - 1)
Array Chunk Bytes 2.86 TiB 67.50 MiB Shape (756768, 721, 1440) (4320, 64, 64) Dask graph 48576 chunks in 2 graph layers Data type float32 numpy.ndarray - fdir(valid_time, latitude, longitude)float32dask.array<chunksize=(4320, 64, 64), meta=np.ndarray>
- GRIB_NV :
- 0
- GRIB_Nx :
- 1440
- GRIB_Ny :
- 721
- GRIB_cfName :
- unknown
- GRIB_cfVarName :
- fdir
- GRIB_dataType :
- fc
- GRIB_gridDefinitionDescription :
- Latitude/Longitude Grid
- GRIB_gridType :
- regular_ll
- GRIB_iDirectionIncrementInDegrees :
- 0.25
- GRIB_iScansNegatively :
- 0
- GRIB_jDirectionIncrementInDegrees :
- 0.25
- GRIB_jPointsAreConsecutive :
- 0
- GRIB_jScansPositively :
- 0
- GRIB_latitudeOfFirstGridPointInDegrees :
- 90.0
- GRIB_latitudeOfLastGridPointInDegrees :
- -90.0
- GRIB_longitudeOfFirstGridPointInDegrees :
- 0.0
- GRIB_longitudeOfLastGridPointInDegrees :
- 359.75
- GRIB_missingValue :
- 3.4028234663852886e+38
- GRIB_name :
- Surface direct short-wave (solar) radiation
- GRIB_numberOfPoints :
- 1038240
- GRIB_paramId :
- 228021
- GRIB_shortName :
- fdir
- GRIB_stepType :
- accum
- GRIB_stepUnits :
- 1
- GRIB_totalNumber :
- 0
- GRIB_typeOfLevel :
- surface
- GRIB_units :
- J m**-2
- GRIB_uvRelativeToGrid :
- 0
- long_name :
- Surface direct short-wave (solar) radiation
- standard_name :
- unknown
- units :
- J m**-2
Array Chunk Bytes 2.86 TiB 67.50 MiB Shape (756768, 721, 1440) (4320, 64, 64) Dask graph 48576 chunks in 2 graph layers Data type float32 numpy.ndarray - flsr(valid_time, latitude, longitude)float32dask.array<chunksize=(4320, 64, 64), meta=np.ndarray>
- GRIB_NV :
- 0
- GRIB_Nx :
- 1440
- GRIB_Ny :
- 721
- GRIB_cfName :
- unknown
- GRIB_cfVarName :
- flsr
- GRIB_dataType :
- an
- GRIB_gridDefinitionDescription :
- Latitude/Longitude Grid
- GRIB_gridType :
- regular_ll
- GRIB_iDirectionIncrementInDegrees :
- 0.25
- GRIB_iScansNegatively :
- 0
- GRIB_jDirectionIncrementInDegrees :
- 0.25
- GRIB_jPointsAreConsecutive :
- 0
- GRIB_jScansPositively :
- 0
- GRIB_latitudeOfFirstGridPointInDegrees :
- 90.0
- GRIB_latitudeOfLastGridPointInDegrees :
- -90.0
- GRIB_longitudeOfFirstGridPointInDegrees :
- 0.0
- GRIB_longitudeOfLastGridPointInDegrees :
- 359.75
- GRIB_missingValue :
- 3.4028234663852886e+38
- GRIB_name :
- Forecast logarithm of surface roughness for heat
- GRIB_numberOfPoints :
- 1038240
- GRIB_paramId :
- 245
- GRIB_shortName :
- flsr
- GRIB_stepType :
- instant
- GRIB_stepUnits :
- 1
- GRIB_totalNumber :
- 0
- GRIB_typeOfLevel :
- surface
- GRIB_units :
- Numeric
- GRIB_uvRelativeToGrid :
- 0
- long_name :
- Forecast logarithm of surface roughness for heat
- standard_name :
- unknown
- units :
- Numeric
Array Chunk Bytes 2.86 TiB 67.50 MiB Shape (756768, 721, 1440) (4320, 64, 64) Dask graph 48576 chunks in 2 graph layers Data type float32 numpy.ndarray - fsr(valid_time, latitude, longitude)float32dask.array<chunksize=(4320, 64, 64), meta=np.ndarray>
- GRIB_NV :
- 0
- GRIB_Nx :
- 1440
- GRIB_Ny :
- 721
- GRIB_cfName :
- unknown
- GRIB_cfVarName :
- fsr
- GRIB_dataType :
- an
- GRIB_gridDefinitionDescription :
- Latitude/Longitude Grid
- GRIB_gridType :
- regular_ll
- GRIB_iDirectionIncrementInDegrees :
- 0.25
- GRIB_iScansNegatively :
- 0
- GRIB_jDirectionIncrementInDegrees :
- 0.25
- GRIB_jPointsAreConsecutive :
- 0
- GRIB_jScansPositively :
- 0
- GRIB_latitudeOfFirstGridPointInDegrees :
- 90.0
- GRIB_latitudeOfLastGridPointInDegrees :
- -90.0
- GRIB_longitudeOfFirstGridPointInDegrees :
- 0.0
- GRIB_longitudeOfLastGridPointInDegrees :
- 359.75
- GRIB_missingValue :
- 3.4028234663852886e+38
- GRIB_name :
- Forecast surface roughness
- GRIB_numberOfPoints :
- 1038240
- GRIB_paramId :
- 244
- GRIB_shortName :
- fsr
- GRIB_stepType :
- instant
- GRIB_stepUnits :
- 1
- GRIB_totalNumber :
- 0
- GRIB_typeOfLevel :
- surface
- GRIB_units :
- m
- GRIB_uvRelativeToGrid :
- 0
- long_name :
- Forecast surface roughness
- standard_name :
- unknown
- units :
- m
Array Chunk Bytes 2.86 TiB 67.50 MiB Shape (756768, 721, 1440) (4320, 64, 64) Dask graph 48576 chunks in 2 graph layers Data type float32 numpy.ndarray - gwd(valid_time, latitude, longitude)float32dask.array<chunksize=(4320, 64, 64), meta=np.ndarray>
- GRIB_NV :
- 0
- GRIB_Nx :
- 1440
- GRIB_Ny :
- 721
- GRIB_cfName :
- unknown
- GRIB_cfVarName :
- gwd
- GRIB_dataType :
- fc
- GRIB_gridDefinitionDescription :
- Latitude/Longitude Grid
- GRIB_gridType :
- regular_ll
- GRIB_iDirectionIncrementInDegrees :
- 0.25
- GRIB_iScansNegatively :
- 0
- GRIB_jDirectionIncrementInDegrees :
- 0.25
- GRIB_jPointsAreConsecutive :
- 0
- GRIB_jScansPositively :
- 0
- GRIB_latitudeOfFirstGridPointInDegrees :
- 90.0
- GRIB_latitudeOfLastGridPointInDegrees :
- -90.0
- GRIB_longitudeOfFirstGridPointInDegrees :
- 0.0
- GRIB_longitudeOfLastGridPointInDegrees :
- 359.75
- GRIB_missingValue :
- 3.4028234663852886e+38
- GRIB_name :
- Gravity wave dissipation
- GRIB_numberOfPoints :
- 1038240
- GRIB_paramId :
- 197
- GRIB_shortName :
- gwd
- GRIB_stepType :
- accum
- GRIB_stepUnits :
- 1
- GRIB_totalNumber :
- 0
- GRIB_typeOfLevel :
- surface
- GRIB_units :
- J m**-2
- GRIB_uvRelativeToGrid :
- 0
- long_name :
- Gravity wave dissipation
- standard_name :
- unknown
- units :
- J m**-2
Array Chunk Bytes 2.86 TiB 67.50 MiB Shape (756768, 721, 1440) (4320, 64, 64) Dask graph 48576 chunks in 2 graph layers Data type float32 numpy.ndarray - hcc(valid_time, latitude, longitude)float32dask.array<chunksize=(4320, 64, 64), meta=np.ndarray>
- GRIB_NV :
- 0
- GRIB_Nx :
- 1440
- GRIB_Ny :
- 721
- GRIB_cfName :
- unknown
- GRIB_cfVarName :
- hcc
- GRIB_dataType :
- an
- GRIB_gridDefinitionDescription :
- Latitude/Longitude Grid
- GRIB_gridType :
- regular_ll
- GRIB_iDirectionIncrementInDegrees :
- 0.25
- GRIB_iScansNegatively :
- 0
- GRIB_jDirectionIncrementInDegrees :
- 0.25
- GRIB_jPointsAreConsecutive :
- 0
- GRIB_jScansPositively :
- 0
- GRIB_latitudeOfFirstGridPointInDegrees :
- 90.0
- GRIB_latitudeOfLastGridPointInDegrees :
- -90.0
- GRIB_longitudeOfFirstGridPointInDegrees :
- 0.0
- GRIB_longitudeOfLastGridPointInDegrees :
- 359.75
- GRIB_missingValue :
- 3.4028234663852886e+38
- GRIB_name :
- High cloud cover
- GRIB_numberOfPoints :
- 1038240
- GRIB_paramId :
- 188
- GRIB_shortName :
- hcc
- GRIB_stepType :
- instant
- GRIB_stepUnits :
- 1
- GRIB_totalNumber :
- 0
- GRIB_typeOfLevel :
- surface
- GRIB_units :
- (0 - 1)
- GRIB_uvRelativeToGrid :
- 0
- long_name :
- High cloud cover
- standard_name :
- unknown
- units :
- (0 - 1)
Array Chunk Bytes 2.86 TiB 67.50 MiB Shape (756768, 721, 1440) (4320, 64, 64) Dask graph 48576 chunks in 2 graph layers Data type float32 numpy.ndarray - ie(valid_time, latitude, longitude)float32dask.array<chunksize=(4320, 64, 64), meta=np.ndarray>
- GRIB_NV :
- 0
- GRIB_Nx :
- 1440
- GRIB_Ny :
- 721
- GRIB_cfName :
- unknown
- GRIB_cfVarName :
- ie
- GRIB_dataType :
- an
- GRIB_gridDefinitionDescription :
- Latitude/Longitude Grid
- GRIB_gridType :
- regular_ll
- GRIB_iDirectionIncrementInDegrees :
- 0.25
- GRIB_iScansNegatively :
- 0
- GRIB_jDirectionIncrementInDegrees :
- 0.25
- GRIB_jPointsAreConsecutive :
- 0
- GRIB_jScansPositively :
- 0
- GRIB_latitudeOfFirstGridPointInDegrees :
- 90.0
- GRIB_latitudeOfLastGridPointInDegrees :
- -90.0
- GRIB_longitudeOfFirstGridPointInDegrees :
- 0.0
- GRIB_longitudeOfLastGridPointInDegrees :
- 359.75
- GRIB_missingValue :
- 3.4028234663852886e+38
- GRIB_name :
- Instantaneous moisture flux
- GRIB_numberOfPoints :
- 1038240
- GRIB_paramId :
- 232
- GRIB_shortName :
- ie
- GRIB_stepType :
- instant
- GRIB_stepUnits :
- 1
- GRIB_totalNumber :
- 0
- GRIB_typeOfLevel :
- surface
- GRIB_units :
- kg m**-2 s**-1
- GRIB_uvRelativeToGrid :
- 0
- long_name :
- Instantaneous moisture flux
- standard_name :
- unknown
- units :
- kg m**-2 s**-1
Array Chunk Bytes 2.86 TiB 67.50 MiB Shape (756768, 721, 1440) (4320, 64, 64) Dask graph 48576 chunks in 2 graph layers Data type float32 numpy.ndarray - iews(valid_time, latitude, longitude)float32dask.array<chunksize=(4320, 64, 64), meta=np.ndarray>
- GRIB_NV :
- 0
- GRIB_Nx :
- 1440
- GRIB_Ny :
- 721
- GRIB_cfName :
- unknown
- GRIB_cfVarName :
- iews
- GRIB_dataType :
- an
- GRIB_gridDefinitionDescription :
- Latitude/Longitude Grid
- GRIB_gridType :
- regular_ll
- GRIB_iDirectionIncrementInDegrees :
- 0.25
- GRIB_iScansNegatively :
- 0
- GRIB_jDirectionIncrementInDegrees :
- 0.25
- GRIB_jPointsAreConsecutive :
- 0
- GRIB_jScansPositively :
- 0
- GRIB_latitudeOfFirstGridPointInDegrees :
- 90.0
- GRIB_latitudeOfLastGridPointInDegrees :
- -90.0
- GRIB_longitudeOfFirstGridPointInDegrees :
- 0.0
- GRIB_longitudeOfLastGridPointInDegrees :
- 359.75
- GRIB_missingValue :
- 3.4028234663852886e+38
- GRIB_name :
- Instantaneous eastward turbulent surface stress
- GRIB_numberOfPoints :
- 1038240
- GRIB_paramId :
- 229
- GRIB_shortName :
- iews
- GRIB_stepType :
- instant
- GRIB_stepUnits :
- 1
- GRIB_totalNumber :
- 0
- GRIB_typeOfLevel :
- surface
- GRIB_units :
- N m**-2
- GRIB_uvRelativeToGrid :
- 0
- long_name :
- Instantaneous eastward turbulent surface stress
- standard_name :
- unknown
- units :
- N m**-2
Array Chunk Bytes 2.86 TiB 67.50 MiB Shape (756768, 721, 1440) (4320, 64, 64) Dask graph 48576 chunks in 2 graph layers Data type float32 numpy.ndarray - ilspf(valid_time, latitude, longitude)float32dask.array<chunksize=(4320, 64, 64), meta=np.ndarray>
- GRIB_NV :
- 0
- GRIB_Nx :
- 1440
- GRIB_Ny :
- 721
- GRIB_cfName :
- unknown
- GRIB_cfVarName :
- ilspf
- GRIB_dataType :
- fc
- GRIB_gridDefinitionDescription :
- Latitude/Longitude Grid
- GRIB_gridType :
- regular_ll
- GRIB_iDirectionIncrementInDegrees :
- 0.25
- GRIB_iScansNegatively :
- 0
- GRIB_jDirectionIncrementInDegrees :
- 0.25
- GRIB_jPointsAreConsecutive :
- 0
- GRIB_jScansPositively :
- 0
- GRIB_latitudeOfFirstGridPointInDegrees :
- 90.0
- GRIB_latitudeOfLastGridPointInDegrees :
- -90.0
- GRIB_longitudeOfFirstGridPointInDegrees :
- 0.0
- GRIB_longitudeOfLastGridPointInDegrees :
- 359.75
- GRIB_missingValue :
- 3.4028234663852886e+38
- GRIB_name :
- Instantaneous large-scale precipitation fraction
- GRIB_numberOfPoints :
- 1038240
- GRIB_paramId :
- 228217
- GRIB_shortName :
- ilspf
- GRIB_stepType :
- instant
- GRIB_stepUnits :
- 1
- GRIB_totalNumber :
- 0
- GRIB_typeOfLevel :
- surface
- GRIB_units :
- Proportion
- GRIB_uvRelativeToGrid :
- 0
- long_name :
- Instantaneous large-scale precipitation fraction
- standard_name :
- unknown
- units :
- Proportion
Array Chunk Bytes 2.86 TiB 67.50 MiB Shape (756768, 721, 1440) (4320, 64, 64) Dask graph 48576 chunks in 2 graph layers Data type float32 numpy.ndarray - inss(valid_time, latitude, longitude)float32dask.array<chunksize=(4320, 64, 64), meta=np.ndarray>
- GRIB_NV :
- 0
- GRIB_Nx :
- 1440
- GRIB_Ny :
- 721
- GRIB_cfName :
- unknown
- GRIB_cfVarName :
- inss
- GRIB_dataType :
- an
- GRIB_gridDefinitionDescription :
- Latitude/Longitude Grid
- GRIB_gridType :
- regular_ll
- GRIB_iDirectionIncrementInDegrees :
- 0.25
- GRIB_iScansNegatively :
- 0
- GRIB_jDirectionIncrementInDegrees :
- 0.25
- GRIB_jPointsAreConsecutive :
- 0
- GRIB_jScansPositively :
- 0
- GRIB_latitudeOfFirstGridPointInDegrees :
- 90.0
- GRIB_latitudeOfLastGridPointInDegrees :
- -90.0
- GRIB_longitudeOfFirstGridPointInDegrees :
- 0.0
- GRIB_longitudeOfLastGridPointInDegrees :
- 359.75
- GRIB_missingValue :
- 3.4028234663852886e+38
- GRIB_name :
- Instantaneous northward turbulent surface stress
- GRIB_numberOfPoints :
- 1038240
- GRIB_paramId :
- 230
- GRIB_shortName :
- inss
- GRIB_stepType :
- instant
- GRIB_stepUnits :
- 1
- GRIB_totalNumber :
- 0
- GRIB_typeOfLevel :
- surface
- GRIB_units :
- N m**-2
- GRIB_uvRelativeToGrid :
- 0
- long_name :
- Instantaneous northward turbulent surface stress
- standard_name :
- unknown
- units :
- N m**-2
Array Chunk Bytes 2.86 TiB 67.50 MiB Shape (756768, 721, 1440) (4320, 64, 64) Dask graph 48576 chunks in 2 graph layers Data type float32 numpy.ndarray - ishf(valid_time, latitude, longitude)float32dask.array<chunksize=(4320, 64, 64), meta=np.ndarray>
- GRIB_NV :
- 0
- GRIB_Nx :
- 1440
- GRIB_Ny :
- 721
- GRIB_cfName :
- unknown
- GRIB_cfVarName :
- ishf
- GRIB_dataType :
- an
- GRIB_gridDefinitionDescription :
- Latitude/Longitude Grid
- GRIB_gridType :
- regular_ll
- GRIB_iDirectionIncrementInDegrees :
- 0.25
- GRIB_iScansNegatively :
- 0
- GRIB_jDirectionIncrementInDegrees :
- 0.25
- GRIB_jPointsAreConsecutive :
- 0
- GRIB_jScansPositively :
- 0
- GRIB_latitudeOfFirstGridPointInDegrees :
- 90.0
- GRIB_latitudeOfLastGridPointInDegrees :
- -90.0
- GRIB_longitudeOfFirstGridPointInDegrees :
- 0.0
- GRIB_longitudeOfLastGridPointInDegrees :
- 359.75
- GRIB_missingValue :
- 3.4028234663852886e+38
- GRIB_name :
- Instantaneous surface sensible heat net flux
- GRIB_numberOfPoints :
- 1038240
- GRIB_paramId :
- 231
- GRIB_shortName :
- ishf
- GRIB_stepType :
- instant
- GRIB_stepUnits :
- 1
- GRIB_totalNumber :
- 0
- GRIB_typeOfLevel :
- surface
- GRIB_units :
- W m**-2
- GRIB_uvRelativeToGrid :
- 0
- long_name :
- Instantaneous surface sensible heat net flux
- standard_name :
- unknown
- units :
- W m**-2
Array Chunk Bytes 2.86 TiB 67.50 MiB Shape (756768, 721, 1440) (4320, 64, 64) Dask graph 48576 chunks in 2 graph layers Data type float32 numpy.ndarray - isor(valid_time, latitude, longitude)float32dask.array<chunksize=(4320, 64, 64), meta=np.ndarray>
- GRIB_NV :
- 0
- GRIB_Nx :
- 1440
- GRIB_Ny :
- 721
- GRIB_cfName :
- unknown
- GRIB_cfVarName :
- isor
- GRIB_dataType :
- an
- GRIB_gridDefinitionDescription :
- Latitude/Longitude Grid
- GRIB_gridType :
- regular_ll
- GRIB_iDirectionIncrementInDegrees :
- 0.25
- GRIB_iScansNegatively :
- 0
- GRIB_jDirectionIncrementInDegrees :
- 0.25
- GRIB_jPointsAreConsecutive :
- 0
- GRIB_jScansPositively :
- 0
- GRIB_latitudeOfFirstGridPointInDegrees :
- 90.0
- GRIB_latitudeOfLastGridPointInDegrees :
- -90.0
- GRIB_longitudeOfFirstGridPointInDegrees :
- 0.0
- GRIB_longitudeOfLastGridPointInDegrees :
- 359.75
- GRIB_missingValue :
- 3.4028234663852886e+38
- GRIB_name :
- Anisotropy of sub-gridscale orography
- GRIB_numberOfPoints :
- 1038240
- GRIB_paramId :
- 161
- GRIB_shortName :
- isor
- GRIB_stepType :
- instant
- GRIB_stepUnits :
- 1
- GRIB_totalNumber :
- 0
- GRIB_typeOfLevel :
- surface
- GRIB_units :
- Numeric
- GRIB_uvRelativeToGrid :
- 0
- long_name :
- Anisotropy of sub-gridscale orography
- standard_name :
- unknown
- units :
- Numeric
Array Chunk Bytes 2.86 TiB 67.50 MiB Shape (756768, 721, 1440) (4320, 64, 64) Dask graph 48576 chunks in 2 graph layers Data type float32 numpy.ndarray - istl1(valid_time, latitude, longitude)float32dask.array<chunksize=(4320, 64, 64), meta=np.ndarray>
- GRIB_NV :
- 0
- GRIB_Nx :
- 1440
- GRIB_Ny :
- 721
- GRIB_cfName :
- unknown
- GRIB_cfVarName :
- istl1
- GRIB_dataType :
- an
- GRIB_gridDefinitionDescription :
- Latitude/Longitude Grid
- GRIB_gridType :
- regular_ll
- GRIB_iDirectionIncrementInDegrees :
- 0.25
- GRIB_iScansNegatively :
- 0
- GRIB_jDirectionIncrementInDegrees :
- 0.25
- GRIB_jPointsAreConsecutive :
- 0
- GRIB_jScansPositively :
- 0
- GRIB_latitudeOfFirstGridPointInDegrees :
- 90.0
- GRIB_latitudeOfLastGridPointInDegrees :
- -90.0
- GRIB_longitudeOfFirstGridPointInDegrees :
- 0.0
- GRIB_longitudeOfLastGridPointInDegrees :
- 359.75
- GRIB_missingValue :
- 3.4028234663852886e+38
- GRIB_name :
- Ice temperature layer 1
- GRIB_numberOfPoints :
- 1038240
- GRIB_paramId :
- 35
- GRIB_shortName :
- istl1
- GRIB_stepType :
- instant
- GRIB_stepUnits :
- 1
- GRIB_totalNumber :
- 0
- GRIB_typeOfLevel :
- depthBelowLandLayer
- GRIB_units :
- K
- GRIB_uvRelativeToGrid :
- 0
- long_name :
- Ice temperature layer 1
- standard_name :
- unknown
- units :
- K
Array Chunk Bytes 2.86 TiB 67.50 MiB Shape (756768, 721, 1440) (4320, 64, 64) Dask graph 48576 chunks in 2 graph layers Data type float32 numpy.ndarray - istl2(valid_time, latitude, longitude)float32dask.array<chunksize=(4320, 64, 64), meta=np.ndarray>
- GRIB_NV :
- 0
- GRIB_Nx :
- 1440
- GRIB_Ny :
- 721
- GRIB_cfName :
- unknown
- GRIB_cfVarName :
- istl2
- GRIB_dataType :
- an
- GRIB_gridDefinitionDescription :
- Latitude/Longitude Grid
- GRIB_gridType :
- regular_ll
- GRIB_iDirectionIncrementInDegrees :
- 0.25
- GRIB_iScansNegatively :
- 0
- GRIB_jDirectionIncrementInDegrees :
- 0.25
- GRIB_jPointsAreConsecutive :
- 0
- GRIB_jScansPositively :
- 0
- GRIB_latitudeOfFirstGridPointInDegrees :
- 90.0
- GRIB_latitudeOfLastGridPointInDegrees :
- -90.0
- GRIB_longitudeOfFirstGridPointInDegrees :
- 0.0
- GRIB_longitudeOfLastGridPointInDegrees :
- 359.75
- GRIB_missingValue :
- 3.4028234663852886e+38
- GRIB_name :
- Ice temperature layer 2
- GRIB_numberOfPoints :
- 1038240
- GRIB_paramId :
- 36
- GRIB_shortName :
- istl2
- GRIB_stepType :
- instant
- GRIB_stepUnits :
- 1
- GRIB_totalNumber :
- 0
- GRIB_typeOfLevel :
- depthBelowLandLayer
- GRIB_units :
- K
- GRIB_uvRelativeToGrid :
- 0
- long_name :
- Ice temperature layer 2
- standard_name :
- unknown
- units :
- K
Array Chunk Bytes 2.86 TiB 67.50 MiB Shape (756768, 721, 1440) (4320, 64, 64) Dask graph 48576 chunks in 2 graph layers Data type float32 numpy.ndarray - istl3(valid_time, latitude, longitude)float32dask.array<chunksize=(4320, 64, 64), meta=np.ndarray>
- GRIB_NV :
- 0
- GRIB_Nx :
- 1440
- GRIB_Ny :
- 721
- GRIB_cfName :
- unknown
- GRIB_cfVarName :
- istl3
- GRIB_dataType :
- an
- GRIB_gridDefinitionDescription :
- Latitude/Longitude Grid
- GRIB_gridType :
- regular_ll
- GRIB_iDirectionIncrementInDegrees :
- 0.25
- GRIB_iScansNegatively :
- 0
- GRIB_jDirectionIncrementInDegrees :
- 0.25
- GRIB_jPointsAreConsecutive :
- 0
- GRIB_jScansPositively :
- 0
- GRIB_latitudeOfFirstGridPointInDegrees :
- 90.0
- GRIB_latitudeOfLastGridPointInDegrees :
- -90.0
- GRIB_longitudeOfFirstGridPointInDegrees :
- 0.0
- GRIB_longitudeOfLastGridPointInDegrees :
- 359.75
- GRIB_missingValue :
- 3.4028234663852886e+38
- GRIB_name :
- Ice temperature layer 3
- GRIB_numberOfPoints :
- 1038240
- GRIB_paramId :
- 37
- GRIB_shortName :
- istl3
- GRIB_stepType :
- instant
- GRIB_stepUnits :
- 1
- GRIB_totalNumber :
- 0
- GRIB_typeOfLevel :
- depthBelowLandLayer
- GRIB_units :
- K
- GRIB_uvRelativeToGrid :
- 0
- long_name :
- Ice temperature layer 3
- standard_name :
- unknown
- units :
- K
Array Chunk Bytes 2.86 TiB 67.50 MiB Shape (756768, 721, 1440) (4320, 64, 64) Dask graph 48576 chunks in 2 graph layers Data type float32 numpy.ndarray - istl4(valid_time, latitude, longitude)float32dask.array<chunksize=(4320, 64, 64), meta=np.ndarray>
- GRIB_NV :
- 0
- GRIB_Nx :
- 1440
- GRIB_Ny :
- 721
- GRIB_cfName :
- unknown
- GRIB_cfVarName :
- istl4
- GRIB_dataType :
- an
- GRIB_gridDefinitionDescription :
- Latitude/Longitude Grid
- GRIB_gridType :
- regular_ll
- GRIB_iDirectionIncrementInDegrees :
- 0.25
- GRIB_iScansNegatively :
- 0
- GRIB_jDirectionIncrementInDegrees :
- 0.25
- GRIB_jPointsAreConsecutive :
- 0
- GRIB_jScansPositively :
- 0
- GRIB_latitudeOfFirstGridPointInDegrees :
- 90.0
- GRIB_latitudeOfLastGridPointInDegrees :
- -90.0
- GRIB_longitudeOfFirstGridPointInDegrees :
- 0.0
- GRIB_longitudeOfLastGridPointInDegrees :
- 359.75
- GRIB_missingValue :
- 3.4028234663852886e+38
- GRIB_name :
- Ice temperature layer 4
- GRIB_numberOfPoints :
- 1038240
- GRIB_paramId :
- 38
- GRIB_shortName :
- istl4
- GRIB_stepType :
- instant
- GRIB_stepUnits :
- 1
- GRIB_totalNumber :
- 0
- GRIB_typeOfLevel :
- depthBelowLandLayer
- GRIB_units :
- K
- GRIB_uvRelativeToGrid :
- 0
- long_name :
- Ice temperature layer 4
- standard_name :
- unknown
- units :
- K
Array Chunk Bytes 2.86 TiB 67.50 MiB Shape (756768, 721, 1440) (4320, 64, 64) Dask graph 48576 chunks in 2 graph layers Data type float32 numpy.ndarray - kx(valid_time, latitude, longitude)float32dask.array<chunksize=(4320, 64, 64), meta=np.ndarray>
- GRIB_NV :
- 0
- GRIB_Nx :
- 1440
- GRIB_Ny :
- 721
- GRIB_cfName :
- unknown
- GRIB_cfVarName :
- kx
- GRIB_dataType :
- fc
- GRIB_gridDefinitionDescription :
- Latitude/longitude
- GRIB_gridType :
- regular_ll
- GRIB_iDirectionIncrementInDegrees :
- 0.25
- GRIB_iScansNegatively :
- 0
- GRIB_jDirectionIncrementInDegrees :
- 0.25
- GRIB_jPointsAreConsecutive :
- 0
- GRIB_jScansPositively :
- 0
- GRIB_latitudeOfFirstGridPointInDegrees :
- 90.0
- GRIB_latitudeOfLastGridPointInDegrees :
- -90.0
- GRIB_longitudeOfFirstGridPointInDegrees :
- 0.0
- GRIB_longitudeOfLastGridPointInDegrees :
- 359.75
- GRIB_missingValue :
- 3.4028234663852886e+38
- GRIB_name :
- K index
- GRIB_numberOfPoints :
- 1038240
- GRIB_paramId :
- 260121
- GRIB_shortName :
- kx
- GRIB_stepType :
- instant
- GRIB_stepUnits :
- 1
- GRIB_typeOfLevel :
- surface
- GRIB_units :
- K
- GRIB_uvRelativeToGrid :
- 0
- long_name :
- K index
- standard_name :
- unknown
- units :
- K
Array Chunk Bytes 2.86 TiB 67.50 MiB Shape (756768, 721, 1440) (4320, 64, 64) Dask graph 48576 chunks in 2 graph layers Data type float32 numpy.ndarray - lai_hv(valid_time, latitude, longitude)float32dask.array<chunksize=(4320, 64, 64), meta=np.ndarray>
- GRIB_NV :
- 0
- GRIB_Nx :
- 1440
- GRIB_Ny :
- 721
- GRIB_cfName :
- unknown
- GRIB_cfVarName :
- lai_hv
- GRIB_dataType :
- an
- GRIB_gridDefinitionDescription :
- Latitude/Longitude Grid
- GRIB_gridType :
- regular_ll
- GRIB_iDirectionIncrementInDegrees :
- 0.25
- GRIB_iScansNegatively :
- 0
- GRIB_jDirectionIncrementInDegrees :
- 0.25
- GRIB_jPointsAreConsecutive :
- 0
- GRIB_jScansPositively :
- 0
- GRIB_latitudeOfFirstGridPointInDegrees :
- 90.0
- GRIB_latitudeOfLastGridPointInDegrees :
- -90.0
- GRIB_longitudeOfFirstGridPointInDegrees :
- 0.0
- GRIB_longitudeOfLastGridPointInDegrees :
- 359.75
- GRIB_missingValue :
- 3.4028234663852886e+38
- GRIB_name :
- Leaf area index, high vegetation
- GRIB_numberOfPoints :
- 1038240
- GRIB_paramId :
- 67
- GRIB_shortName :
- lai_hv
- GRIB_stepType :
- instant
- GRIB_stepUnits :
- 1
- GRIB_totalNumber :
- 0
- GRIB_typeOfLevel :
- surface
- GRIB_units :
- m**2 m**-2
- GRIB_uvRelativeToGrid :
- 0
- long_name :
- Leaf area index, high vegetation
- standard_name :
- unknown
- units :
- m**2 m**-2
Array Chunk Bytes 2.86 TiB 67.50 MiB Shape (756768, 721, 1440) (4320, 64, 64) Dask graph 48576 chunks in 2 graph layers Data type float32 numpy.ndarray - lai_lv(valid_time, latitude, longitude)float32dask.array<chunksize=(4320, 64, 64), meta=np.ndarray>
- GRIB_NV :
- 0
- GRIB_Nx :
- 1440
- GRIB_Ny :
- 721
- GRIB_cfName :
- unknown
- GRIB_cfVarName :
- lai_lv
- GRIB_dataType :
- an
- GRIB_gridDefinitionDescription :
- Latitude/Longitude Grid
- GRIB_gridType :
- regular_ll
- GRIB_iDirectionIncrementInDegrees :
- 0.25
- GRIB_iScansNegatively :
- 0
- GRIB_jDirectionIncrementInDegrees :
- 0.25
- GRIB_jPointsAreConsecutive :
- 0
- GRIB_jScansPositively :
- 0
- GRIB_latitudeOfFirstGridPointInDegrees :
- 90.0
- GRIB_latitudeOfLastGridPointInDegrees :
- -90.0
- GRIB_longitudeOfFirstGridPointInDegrees :
- 0.0
- GRIB_longitudeOfLastGridPointInDegrees :
- 359.75
- GRIB_missingValue :
- 3.4028234663852886e+38
- GRIB_name :
- Leaf area index, low vegetation
- GRIB_numberOfPoints :
- 1038240
- GRIB_paramId :
- 66
- GRIB_shortName :
- lai_lv
- GRIB_stepType :
- instant
- GRIB_stepUnits :
- 1
- GRIB_totalNumber :
- 0
- GRIB_typeOfLevel :
- surface
- GRIB_units :
- m**2 m**-2
- GRIB_uvRelativeToGrid :
- 0
- long_name :
- Leaf area index, low vegetation
- standard_name :
- unknown
- units :
- m**2 m**-2
Array Chunk Bytes 2.86 TiB 67.50 MiB Shape (756768, 721, 1440) (4320, 64, 64) Dask graph 48576 chunks in 2 graph layers Data type float32 numpy.ndarray - lblt(valid_time, latitude, longitude)float32dask.array<chunksize=(4320, 64, 64), meta=np.ndarray>
- GRIB_NV :
- 0
- GRIB_Nx :
- 1440
- GRIB_Ny :
- 721
- GRIB_cfName :
- unknown
- GRIB_cfVarName :
- lblt
- GRIB_dataType :
- an
- GRIB_gridDefinitionDescription :
- Latitude/Longitude Grid
- GRIB_gridType :
- regular_ll
- GRIB_iDirectionIncrementInDegrees :
- 0.25
- GRIB_iScansNegatively :
- 0
- GRIB_jDirectionIncrementInDegrees :
- 0.25
- GRIB_jPointsAreConsecutive :
- 0
- GRIB_jScansPositively :
- 0
- GRIB_latitudeOfFirstGridPointInDegrees :
- 90.0
- GRIB_latitudeOfLastGridPointInDegrees :
- -90.0
- GRIB_longitudeOfFirstGridPointInDegrees :
- 0.0
- GRIB_longitudeOfLastGridPointInDegrees :
- 359.75
- GRIB_missingValue :
- 3.4028234663852886e+38
- GRIB_name :
- Lake bottom temperature
- GRIB_numberOfPoints :
- 1038240
- GRIB_paramId :
- 228010
- GRIB_shortName :
- lblt
- GRIB_stepType :
- instant
- GRIB_stepUnits :
- 1
- GRIB_totalNumber :
- 0
- GRIB_typeOfLevel :
- surface
- GRIB_units :
- K
- GRIB_uvRelativeToGrid :
- 0
- long_name :
- Lake bottom temperature
- standard_name :
- unknown
- units :
- K
Array Chunk Bytes 2.86 TiB 67.50 MiB Shape (756768, 721, 1440) (4320, 64, 64) Dask graph 48576 chunks in 2 graph layers Data type float32 numpy.ndarray - lcc(valid_time, latitude, longitude)float32dask.array<chunksize=(4320, 64, 64), meta=np.ndarray>
- GRIB_NV :
- 0
- GRIB_Nx :
- 1440
- GRIB_Ny :
- 721
- GRIB_cfName :
- unknown
- GRIB_cfVarName :
- lcc
- GRIB_dataType :
- an
- GRIB_gridDefinitionDescription :
- Latitude/Longitude Grid
- GRIB_gridType :
- regular_ll
- GRIB_iDirectionIncrementInDegrees :
- 0.25
- GRIB_iScansNegatively :
- 0
- GRIB_jDirectionIncrementInDegrees :
- 0.25
- GRIB_jPointsAreConsecutive :
- 0
- GRIB_jScansPositively :
- 0
- GRIB_latitudeOfFirstGridPointInDegrees :
- 90.0
- GRIB_latitudeOfLastGridPointInDegrees :
- -90.0
- GRIB_longitudeOfFirstGridPointInDegrees :
- 0.0
- GRIB_longitudeOfLastGridPointInDegrees :
- 359.75
- GRIB_missingValue :
- 3.4028234663852886e+38
- GRIB_name :
- Low cloud cover
- GRIB_numberOfPoints :
- 1038240
- GRIB_paramId :
- 186
- GRIB_shortName :
- lcc
- GRIB_stepType :
- instant
- GRIB_stepUnits :
- 1
- GRIB_totalNumber :
- 0
- GRIB_typeOfLevel :
- surface
- GRIB_units :
- (0 - 1)
- GRIB_uvRelativeToGrid :
- 0
- long_name :
- Low cloud cover
- standard_name :
- unknown
- units :
- (0 - 1)
Array Chunk Bytes 2.86 TiB 67.50 MiB Shape (756768, 721, 1440) (4320, 64, 64) Dask graph 48576 chunks in 2 graph layers Data type float32 numpy.ndarray - lgws(valid_time, latitude, longitude)float32dask.array<chunksize=(4320, 64, 64), meta=np.ndarray>
- GRIB_NV :
- 0
- GRIB_Nx :
- 1440
- GRIB_Ny :
- 721
- GRIB_cfName :
- unknown
- GRIB_cfVarName :
- lgws
- GRIB_dataType :
- fc
- GRIB_gridDefinitionDescription :
- Latitude/Longitude Grid
- GRIB_gridType :
- regular_ll
- GRIB_iDirectionIncrementInDegrees :
- 0.25
- GRIB_iScansNegatively :
- 0
- GRIB_jDirectionIncrementInDegrees :
- 0.25
- GRIB_jPointsAreConsecutive :
- 0
- GRIB_jScansPositively :
- 0
- GRIB_latitudeOfFirstGridPointInDegrees :
- 90.0
- GRIB_latitudeOfLastGridPointInDegrees :
- -90.0
- GRIB_longitudeOfFirstGridPointInDegrees :
- 0.0
- GRIB_longitudeOfLastGridPointInDegrees :
- 359.75
- GRIB_missingValue :
- 3.4028234663852886e+38
- GRIB_name :
- Eastward gravity wave surface stress
- GRIB_numberOfPoints :
- 1038240
- GRIB_paramId :
- 195
- GRIB_shortName :
- lgws
- GRIB_stepType :
- accum
- GRIB_stepUnits :
- 1
- GRIB_totalNumber :
- 0
- GRIB_typeOfLevel :
- surface
- GRIB_units :
- N m**-2 s
- GRIB_uvRelativeToGrid :
- 0
- long_name :
- Eastward gravity wave surface stress
- standard_name :
- unknown
- units :
- N m**-2 s
Array Chunk Bytes 2.86 TiB 67.50 MiB Shape (756768, 721, 1440) (4320, 64, 64) Dask graph 48576 chunks in 2 graph layers Data type float32 numpy.ndarray - licd(valid_time, latitude, longitude)float32dask.array<chunksize=(4320, 64, 64), meta=np.ndarray>
- GRIB_NV :
- 0
- GRIB_Nx :
- 1440
- GRIB_Ny :
- 721
- GRIB_cfName :
- unknown
- GRIB_cfVarName :
- licd
- GRIB_dataType :
- an
- GRIB_gridDefinitionDescription :
- Latitude/Longitude Grid
- GRIB_gridType :
- regular_ll
- GRIB_iDirectionIncrementInDegrees :
- 0.25
- GRIB_iScansNegatively :
- 0
- GRIB_jDirectionIncrementInDegrees :
- 0.25
- GRIB_jPointsAreConsecutive :
- 0
- GRIB_jScansPositively :
- 0
- GRIB_latitudeOfFirstGridPointInDegrees :
- 90.0
- GRIB_latitudeOfLastGridPointInDegrees :
- -90.0
- GRIB_longitudeOfFirstGridPointInDegrees :
- 0.0
- GRIB_longitudeOfLastGridPointInDegrees :
- 359.75
- GRIB_missingValue :
- 3.4028234663852886e+38
- GRIB_name :
- Lake ice total depth
- GRIB_numberOfPoints :
- 1038240
- GRIB_paramId :
- 228014
- GRIB_shortName :
- licd
- GRIB_stepType :
- instant
- GRIB_stepUnits :
- 1
- GRIB_totalNumber :
- 0
- GRIB_typeOfLevel :
- surface
- GRIB_units :
- m
- GRIB_uvRelativeToGrid :
- 0
- long_name :
- Lake ice total depth
- standard_name :
- unknown
- units :
- m
Array Chunk Bytes 2.86 TiB 67.50 MiB Shape (756768, 721, 1440) (4320, 64, 64) Dask graph 48576 chunks in 2 graph layers Data type float32 numpy.ndarray - lict(valid_time, latitude, longitude)float32dask.array<chunksize=(4320, 64, 64), meta=np.ndarray>
- GRIB_NV :
- 0
- GRIB_Nx :
- 1440
- GRIB_Ny :
- 721
- GRIB_cfName :
- unknown
- GRIB_cfVarName :
- lict
- GRIB_dataType :
- an
- GRIB_gridDefinitionDescription :
- Latitude/Longitude Grid
- GRIB_gridType :
- regular_ll
- GRIB_iDirectionIncrementInDegrees :
- 0.25
- GRIB_iScansNegatively :
- 0
- GRIB_jDirectionIncrementInDegrees :
- 0.25
- GRIB_jPointsAreConsecutive :
- 0
- GRIB_jScansPositively :
- 0
- GRIB_latitudeOfFirstGridPointInDegrees :
- 90.0
- GRIB_latitudeOfLastGridPointInDegrees :
- -90.0
- GRIB_longitudeOfFirstGridPointInDegrees :
- 0.0
- GRIB_longitudeOfLastGridPointInDegrees :
- 359.75
- GRIB_missingValue :
- 3.4028234663852886e+38
- GRIB_name :
- Lake ice surface temperature
- GRIB_numberOfPoints :
- 1038240
- GRIB_paramId :
- 228013
- GRIB_shortName :
- lict
- GRIB_stepType :
- instant
- GRIB_stepUnits :
- 1
- GRIB_totalNumber :
- 0
- GRIB_typeOfLevel :
- surface
- GRIB_units :
- K
- GRIB_uvRelativeToGrid :
- 0
- long_name :
- Lake ice surface temperature
- standard_name :
- unknown
- units :
- K
Array Chunk Bytes 2.86 TiB 67.50 MiB Shape (756768, 721, 1440) (4320, 64, 64) Dask graph 48576 chunks in 2 graph layers Data type float32 numpy.ndarray - lmld(valid_time, latitude, longitude)float32dask.array<chunksize=(4320, 64, 64), meta=np.ndarray>
- GRIB_NV :
- 0
- GRIB_Nx :
- 1440
- GRIB_Ny :
- 721
- GRIB_cfName :
- unknown
- GRIB_cfVarName :
- lmld
- GRIB_dataType :
- an
- GRIB_gridDefinitionDescription :
- Latitude/Longitude Grid
- GRIB_gridType :
- regular_ll
- GRIB_iDirectionIncrementInDegrees :
- 0.25
- GRIB_iScansNegatively :
- 0
- GRIB_jDirectionIncrementInDegrees :
- 0.25
- GRIB_jPointsAreConsecutive :
- 0
- GRIB_jScansPositively :
- 0
- GRIB_latitudeOfFirstGridPointInDegrees :
- 90.0
- GRIB_latitudeOfLastGridPointInDegrees :
- -90.0
- GRIB_longitudeOfFirstGridPointInDegrees :
- 0.0
- GRIB_longitudeOfLastGridPointInDegrees :
- 359.75
- GRIB_missingValue :
- 3.4028234663852886e+38
- GRIB_name :
- Lake mix-layer depth
- GRIB_numberOfPoints :
- 1038240
- GRIB_paramId :
- 228009
- GRIB_shortName :
- lmld
- GRIB_stepType :
- instant
- GRIB_stepUnits :
- 1
- GRIB_totalNumber :
- 0
- GRIB_typeOfLevel :
- surface
- GRIB_units :
- m
- GRIB_uvRelativeToGrid :
- 0
- long_name :
- Lake mix-layer depth
- standard_name :
- unknown
- units :
- m
Array Chunk Bytes 2.86 TiB 67.50 MiB Shape (756768, 721, 1440) (4320, 64, 64) Dask graph 48576 chunks in 2 graph layers Data type float32 numpy.ndarray - lmlt(valid_time, latitude, longitude)float32dask.array<chunksize=(4320, 64, 64), meta=np.ndarray>
- GRIB_NV :
- 0
- GRIB_Nx :
- 1440
- GRIB_Ny :
- 721
- GRIB_cfName :
- unknown
- GRIB_cfVarName :
- lmlt
- GRIB_dataType :
- an
- GRIB_gridDefinitionDescription :
- Latitude/Longitude Grid
- GRIB_gridType :
- regular_ll
- GRIB_iDirectionIncrementInDegrees :
- 0.25
- GRIB_iScansNegatively :
- 0
- GRIB_jDirectionIncrementInDegrees :
- 0.25
- GRIB_jPointsAreConsecutive :
- 0
- GRIB_jScansPositively :
- 0
- GRIB_latitudeOfFirstGridPointInDegrees :
- 90.0
- GRIB_latitudeOfLastGridPointInDegrees :
- -90.0
- GRIB_longitudeOfFirstGridPointInDegrees :
- 0.0
- GRIB_longitudeOfLastGridPointInDegrees :
- 359.75
- GRIB_missingValue :
- 3.4028234663852886e+38
- GRIB_name :
- Lake mix-layer temperature
- GRIB_numberOfPoints :
- 1038240
- GRIB_paramId :
- 228008
- GRIB_shortName :
- lmlt
- GRIB_stepType :
- instant
- GRIB_stepUnits :
- 1
- GRIB_totalNumber :
- 0
- GRIB_typeOfLevel :
- surface
- GRIB_units :
- K
- GRIB_uvRelativeToGrid :
- 0
- long_name :
- Lake mix-layer temperature
- standard_name :
- unknown
- units :
- K
Array Chunk Bytes 2.86 TiB 67.50 MiB Shape (756768, 721, 1440) (4320, 64, 64) Dask graph 48576 chunks in 2 graph layers Data type float32 numpy.ndarray - lsf(valid_time, latitude, longitude)float32dask.array<chunksize=(4320, 64, 64), meta=np.ndarray>
- GRIB_NV :
- 0
- GRIB_Nx :
- 1440
- GRIB_Ny :
- 721
- GRIB_cfName :
- unknown
- GRIB_cfVarName :
- lsf
- GRIB_dataType :
- fc
- GRIB_gridDefinitionDescription :
- Latitude/Longitude Grid
- GRIB_gridType :
- regular_ll
- GRIB_iDirectionIncrementInDegrees :
- 0.25
- GRIB_iScansNegatively :
- 0
- GRIB_jDirectionIncrementInDegrees :
- 0.25
- GRIB_jPointsAreConsecutive :
- 0
- GRIB_jScansPositively :
- 0
- GRIB_latitudeOfFirstGridPointInDegrees :
- 90.0
- GRIB_latitudeOfLastGridPointInDegrees :
- -90.0
- GRIB_longitudeOfFirstGridPointInDegrees :
- 0.0
- GRIB_longitudeOfLastGridPointInDegrees :
- 359.75
- GRIB_missingValue :
- 3.4028234663852886e+38
- GRIB_name :
- Large-scale snowfall
- GRIB_numberOfPoints :
- 1038240
- GRIB_paramId :
- 240
- GRIB_shortName :
- lsf
- GRIB_stepType :
- accum
- GRIB_stepUnits :
- 1
- GRIB_totalNumber :
- 0
- GRIB_typeOfLevel :
- surface
- GRIB_units :
- m of water equivalent
- GRIB_uvRelativeToGrid :
- 0
- long_name :
- Large-scale snowfall
- standard_name :
- unknown
- units :
- m of water equivalent
Array Chunk Bytes 2.86 TiB 67.50 MiB Shape (756768, 721, 1440) (4320, 64, 64) Dask graph 48576 chunks in 2 graph layers Data type float32 numpy.ndarray - lshf(valid_time, latitude, longitude)float32dask.array<chunksize=(4320, 64, 64), meta=np.ndarray>
- GRIB_NV :
- 0
- GRIB_Nx :
- 1440
- GRIB_Ny :
- 721
- GRIB_cfName :
- unknown
- GRIB_cfVarName :
- lshf
- GRIB_dataType :
- an
- GRIB_gridDefinitionDescription :
- Latitude/Longitude Grid
- GRIB_gridType :
- regular_ll
- GRIB_iDirectionIncrementInDegrees :
- 0.25
- GRIB_iScansNegatively :
- 0
- GRIB_jDirectionIncrementInDegrees :
- 0.25
- GRIB_jPointsAreConsecutive :
- 0
- GRIB_jScansPositively :
- 0
- GRIB_latitudeOfFirstGridPointInDegrees :
- 90.0
- GRIB_latitudeOfLastGridPointInDegrees :
- -90.0
- GRIB_longitudeOfFirstGridPointInDegrees :
- 0.0
- GRIB_longitudeOfLastGridPointInDegrees :
- 359.75
- GRIB_missingValue :
- 3.4028234663852886e+38
- GRIB_name :
- Lake shape factor
- GRIB_numberOfPoints :
- 1038240
- GRIB_paramId :
- 228012
- GRIB_shortName :
- lshf
- GRIB_stepType :
- instant
- GRIB_stepUnits :
- 1
- GRIB_totalNumber :
- 0
- GRIB_typeOfLevel :
- surface
- GRIB_units :
- dimensionless
- GRIB_uvRelativeToGrid :
- 0
- long_name :
- Lake shape factor
- standard_name :
- unknown
- units :
- dimensionless
Array Chunk Bytes 2.86 TiB 67.50 MiB Shape (756768, 721, 1440) (4320, 64, 64) Dask graph 48576 chunks in 2 graph layers Data type float32 numpy.ndarray - lsm(valid_time, latitude, longitude)float32dask.array<chunksize=(4320, 64, 64), meta=np.ndarray>
- GRIB_NV :
- 0
- GRIB_Nx :
- 1440
- GRIB_Ny :
- 721
- GRIB_cfName :
- land_binary_mask
- GRIB_cfVarName :
- lsm
- GRIB_dataType :
- an
- GRIB_gridDefinitionDescription :
- Latitude/Longitude Grid
- GRIB_gridType :
- regular_ll
- GRIB_iDirectionIncrementInDegrees :
- 0.25
- GRIB_iScansNegatively :
- 0
- GRIB_jDirectionIncrementInDegrees :
- 0.25
- GRIB_jPointsAreConsecutive :
- 0
- GRIB_jScansPositively :
- 0
- GRIB_latitudeOfFirstGridPointInDegrees :
- 90.0
- GRIB_latitudeOfLastGridPointInDegrees :
- -90.0
- GRIB_longitudeOfFirstGridPointInDegrees :
- 0.0
- GRIB_longitudeOfLastGridPointInDegrees :
- 359.75
- GRIB_missingValue :
- 3.4028234663852886e+38
- GRIB_name :
- Land-sea mask
- GRIB_numberOfPoints :
- 1038240
- GRIB_paramId :
- 172
- GRIB_shortName :
- lsm
- GRIB_stepType :
- instant
- GRIB_stepUnits :
- 1
- GRIB_totalNumber :
- 0
- GRIB_typeOfLevel :
- surface
- GRIB_units :
- (0 - 1)
- GRIB_uvRelativeToGrid :
- 0
- long_name :
- Land-sea mask
- standard_name :
- land_binary_mask
- units :
- (0 - 1)
Array Chunk Bytes 2.86 TiB 67.50 MiB Shape (756768, 721, 1440) (4320, 64, 64) Dask graph 48576 chunks in 2 graph layers Data type float32 numpy.ndarray - lsp(valid_time, latitude, longitude)float32dask.array<chunksize=(4320, 64, 64), meta=np.ndarray>
- GRIB_NV :
- 0
- GRIB_Nx :
- 1440
- GRIB_Ny :
- 721
- GRIB_cfName :
- lwe_thickness_of_stratiform_precipitation_amount
- GRIB_cfVarName :
- lsp
- GRIB_dataType :
- fc
- GRIB_gridDefinitionDescription :
- Latitude/Longitude Grid
- GRIB_gridType :
- regular_ll
- GRIB_iDirectionIncrementInDegrees :
- 0.25
- GRIB_iScansNegatively :
- 0
- GRIB_jDirectionIncrementInDegrees :
- 0.25
- GRIB_jPointsAreConsecutive :
- 0
- GRIB_jScansPositively :
- 0
- GRIB_latitudeOfFirstGridPointInDegrees :
- 90.0
- GRIB_latitudeOfLastGridPointInDegrees :
- -90.0
- GRIB_longitudeOfFirstGridPointInDegrees :
- 0.0
- GRIB_longitudeOfLastGridPointInDegrees :
- 359.75
- GRIB_missingValue :
- 3.4028234663852886e+38
- GRIB_name :
- Large-scale precipitation
- GRIB_numberOfPoints :
- 1038240
- GRIB_paramId :
- 142
- GRIB_shortName :
- lsp
- GRIB_stepType :
- accum
- GRIB_stepUnits :
- 1
- GRIB_totalNumber :
- 0
- GRIB_typeOfLevel :
- surface
- GRIB_units :
- m
- GRIB_uvRelativeToGrid :
- 0
- long_name :
- Large-scale precipitation
- standard_name :
- lwe_thickness_of_stratiform_precipitation_amount
- units :
- m
Array Chunk Bytes 2.86 TiB 67.50 MiB Shape (756768, 721, 1440) (4320, 64, 64) Dask graph 48576 chunks in 2 graph layers Data type float32 numpy.ndarray - lspf(valid_time, latitude, longitude)float32dask.array<chunksize=(4320, 64, 64), meta=np.ndarray>
- GRIB_NV :
- 0
- GRIB_Nx :
- 1440
- GRIB_Ny :
- 721
- GRIB_cfName :
- unknown
- GRIB_cfVarName :
- lspf
- GRIB_dataType :
- fc
- GRIB_gridDefinitionDescription :
- Latitude/Longitude Grid
- GRIB_gridType :
- regular_ll
- GRIB_iDirectionIncrementInDegrees :
- 0.25
- GRIB_iScansNegatively :
- 0
- GRIB_jDirectionIncrementInDegrees :
- 0.25
- GRIB_jPointsAreConsecutive :
- 0
- GRIB_jScansPositively :
- 0
- GRIB_latitudeOfFirstGridPointInDegrees :
- 90.0
- GRIB_latitudeOfLastGridPointInDegrees :
- -90.0
- GRIB_longitudeOfFirstGridPointInDegrees :
- 0.0
- GRIB_longitudeOfLastGridPointInDegrees :
- 359.75
- GRIB_missingValue :
- 3.4028234663852886e+38
- GRIB_name :
- Large-scale precipitation fraction
- GRIB_numberOfPoints :
- 1038240
- GRIB_paramId :
- 50
- GRIB_shortName :
- lspf
- GRIB_stepType :
- accum
- GRIB_stepUnits :
- 1
- GRIB_totalNumber :
- 0
- GRIB_typeOfLevel :
- surface
- GRIB_units :
- s
- GRIB_uvRelativeToGrid :
- 0
- long_name :
- Large-scale precipitation fraction
- standard_name :
- unknown
- units :
- s
Array Chunk Bytes 2.86 TiB 67.50 MiB Shape (756768, 721, 1440) (4320, 64, 64) Dask graph 48576 chunks in 2 graph layers Data type float32 numpy.ndarray - lsrr(valid_time, latitude, longitude)float32dask.array<chunksize=(4320, 64, 64), meta=np.ndarray>
- GRIB_NV :
- 0
- GRIB_Nx :
- 1440
- GRIB_Ny :
- 721
- GRIB_cfName :
- unknown
- GRIB_cfVarName :
- lsrr
- GRIB_dataType :
- fc
- GRIB_gridDefinitionDescription :
- Latitude/Longitude Grid
- GRIB_gridType :
- regular_ll
- GRIB_iDirectionIncrementInDegrees :
- 0.25
- GRIB_iScansNegatively :
- 0
- GRIB_jDirectionIncrementInDegrees :
- 0.25
- GRIB_jPointsAreConsecutive :
- 0
- GRIB_jScansPositively :
- 0
- GRIB_latitudeOfFirstGridPointInDegrees :
- 90.0
- GRIB_latitudeOfLastGridPointInDegrees :
- -90.0
- GRIB_longitudeOfFirstGridPointInDegrees :
- 0.0
- GRIB_longitudeOfLastGridPointInDegrees :
- 359.75
- GRIB_missingValue :
- 3.4028234663852886e+38
- GRIB_name :
- Large scale rain rate
- GRIB_numberOfPoints :
- 1038240
- GRIB_paramId :
- 228219
- GRIB_shortName :
- lsrr
- GRIB_stepType :
- instant
- GRIB_stepUnits :
- 1
- GRIB_totalNumber :
- 0
- GRIB_typeOfLevel :
- surface
- GRIB_units :
- kg m**-2 s**-1
- GRIB_uvRelativeToGrid :
- 0
- long_name :
- Large scale rain rate
- standard_name :
- unknown
- units :
- kg m**-2 s**-1
Array Chunk Bytes 2.86 TiB 67.50 MiB Shape (756768, 721, 1440) (4320, 64, 64) Dask graph 48576 chunks in 2 graph layers Data type float32 numpy.ndarray - lssfr(valid_time, latitude, longitude)float32dask.array<chunksize=(4320, 64, 64), meta=np.ndarray>
- GRIB_NV :
- 0
- GRIB_Nx :
- 1440
- GRIB_Ny :
- 721
- GRIB_cfName :
- unknown
- GRIB_cfVarName :
- lssfr
- GRIB_dataType :
- fc
- GRIB_gridDefinitionDescription :
- Latitude/Longitude Grid
- GRIB_gridType :
- regular_ll
- GRIB_iDirectionIncrementInDegrees :
- 0.25
- GRIB_iScansNegatively :
- 0
- GRIB_jDirectionIncrementInDegrees :
- 0.25
- GRIB_jPointsAreConsecutive :
- 0
- GRIB_jScansPositively :
- 0
- GRIB_latitudeOfFirstGridPointInDegrees :
- 90.0
- GRIB_latitudeOfLastGridPointInDegrees :
- -90.0
- GRIB_longitudeOfFirstGridPointInDegrees :
- 0.0
- GRIB_longitudeOfLastGridPointInDegrees :
- 359.75
- GRIB_missingValue :
- 3.4028234663852886e+38
- GRIB_name :
- Large scale snowfall rate water equivalent
- GRIB_numberOfPoints :
- 1038240
- GRIB_paramId :
- 228221
- GRIB_shortName :
- lssfr
- GRIB_stepType :
- instant
- GRIB_stepUnits :
- 1
- GRIB_totalNumber :
- 0
- GRIB_typeOfLevel :
- surface
- GRIB_units :
- kg m**-2 s**-1
- GRIB_uvRelativeToGrid :
- 0
- long_name :
- Large scale snowfall rate water equivalent
- standard_name :
- unknown
- units :
- kg m**-2 s**-1
Array Chunk Bytes 2.86 TiB 67.50 MiB Shape (756768, 721, 1440) (4320, 64, 64) Dask graph 48576 chunks in 2 graph layers Data type float32 numpy.ndarray - ltlt(valid_time, latitude, longitude)float32dask.array<chunksize=(4320, 64, 64), meta=np.ndarray>
- GRIB_NV :
- 0
- GRIB_Nx :
- 1440
- GRIB_Ny :
- 721
- GRIB_cfName :
- unknown
- GRIB_cfVarName :
- ltlt
- GRIB_dataType :
- an
- GRIB_gridDefinitionDescription :
- Latitude/Longitude Grid
- GRIB_gridType :
- regular_ll
- GRIB_iDirectionIncrementInDegrees :
- 0.25
- GRIB_iScansNegatively :
- 0
- GRIB_jDirectionIncrementInDegrees :
- 0.25
- GRIB_jPointsAreConsecutive :
- 0
- GRIB_jScansPositively :
- 0
- GRIB_latitudeOfFirstGridPointInDegrees :
- 90.0
- GRIB_latitudeOfLastGridPointInDegrees :
- -90.0
- GRIB_longitudeOfFirstGridPointInDegrees :
- 0.0
- GRIB_longitudeOfLastGridPointInDegrees :
- 359.75
- GRIB_missingValue :
- 3.4028234663852886e+38
- GRIB_name :
- Lake total layer temperature
- GRIB_numberOfPoints :
- 1038240
- GRIB_paramId :
- 228011
- GRIB_shortName :
- ltlt
- GRIB_stepType :
- instant
- GRIB_stepUnits :
- 1
- GRIB_totalNumber :
- 0
- GRIB_typeOfLevel :
- surface
- GRIB_units :
- K
- GRIB_uvRelativeToGrid :
- 0
- long_name :
- Lake total layer temperature
- standard_name :
- unknown
- units :
- K
Array Chunk Bytes 2.86 TiB 67.50 MiB Shape (756768, 721, 1440) (4320, 64, 64) Dask graph 48576 chunks in 2 graph layers Data type float32 numpy.ndarray - mcc(valid_time, latitude, longitude)float32dask.array<chunksize=(4320, 64, 64), meta=np.ndarray>
- GRIB_NV :
- 0
- GRIB_Nx :
- 1440
- GRIB_Ny :
- 721
- GRIB_cfName :
- unknown
- GRIB_cfVarName :
- mcc
- GRIB_dataType :
- an
- GRIB_gridDefinitionDescription :
- Latitude/Longitude Grid
- GRIB_gridType :
- regular_ll
- GRIB_iDirectionIncrementInDegrees :
- 0.25
- GRIB_iScansNegatively :
- 0
- GRIB_jDirectionIncrementInDegrees :
- 0.25
- GRIB_jPointsAreConsecutive :
- 0
- GRIB_jScansPositively :
- 0
- GRIB_latitudeOfFirstGridPointInDegrees :
- 90.0
- GRIB_latitudeOfLastGridPointInDegrees :
- -90.0
- GRIB_longitudeOfFirstGridPointInDegrees :
- 0.0
- GRIB_longitudeOfLastGridPointInDegrees :
- 359.75
- GRIB_missingValue :
- 3.4028234663852886e+38
- GRIB_name :
- Medium cloud cover
- GRIB_numberOfPoints :
- 1038240
- GRIB_paramId :
- 187
- GRIB_shortName :
- mcc
- GRIB_stepType :
- instant
- GRIB_stepUnits :
- 1
- GRIB_totalNumber :
- 0
- GRIB_typeOfLevel :
- surface
- GRIB_units :
- (0 - 1)
- GRIB_uvRelativeToGrid :
- 0
- long_name :
- Medium cloud cover
- standard_name :
- unknown
- units :
- (0 - 1)
Array Chunk Bytes 2.86 TiB 67.50 MiB Shape (756768, 721, 1440) (4320, 64, 64) Dask graph 48576 chunks in 2 graph layers Data type float32 numpy.ndarray - mn2t(valid_time, latitude, longitude)float32dask.array<chunksize=(4320, 64, 64), meta=np.ndarray>
- GRIB_NV :
- 0
- GRIB_Nx :
- 1440
- GRIB_Ny :
- 721
- GRIB_cfName :
- unknown
- GRIB_cfVarName :
- mn2t
- GRIB_dataType :
- fc
- GRIB_gridDefinitionDescription :
- Latitude/Longitude Grid
- GRIB_gridType :
- regular_ll
- GRIB_iDirectionIncrementInDegrees :
- 0.25
- GRIB_iScansNegatively :
- 0
- GRIB_jDirectionIncrementInDegrees :
- 0.25
- GRIB_jPointsAreConsecutive :
- 0
- GRIB_jScansPositively :
- 0
- GRIB_latitudeOfFirstGridPointInDegrees :
- 90.0
- GRIB_latitudeOfLastGridPointInDegrees :
- -90.0
- GRIB_longitudeOfFirstGridPointInDegrees :
- 0.0
- GRIB_longitudeOfLastGridPointInDegrees :
- 359.75
- GRIB_missingValue :
- 3.4028234663852886e+38
- GRIB_name :
- Minimum temperature at 2 metres since previous post-processing
- GRIB_numberOfPoints :
- 1038240
- GRIB_paramId :
- 202
- GRIB_shortName :
- mn2t
- GRIB_stepType :
- max
- GRIB_stepUnits :
- 1
- GRIB_totalNumber :
- 0
- GRIB_typeOfLevel :
- surface
- GRIB_units :
- K
- GRIB_uvRelativeToGrid :
- 0
- long_name :
- Minimum temperature at 2 metres since previous post-processing
- standard_name :
- unknown
- units :
- K
Array Chunk Bytes 2.86 TiB 67.50 MiB Shape (756768, 721, 1440) (4320, 64, 64) Dask graph 48576 chunks in 2 graph layers Data type float32 numpy.ndarray - mntpr(valid_time, latitude, longitude)float32dask.array<chunksize=(4320, 64, 64), meta=np.ndarray>
- GRIB_NV :
- 0
- GRIB_Nx :
- 1440
- GRIB_Ny :
- 721
- GRIB_cfName :
- unknown
- GRIB_cfVarName :
- mntpr
- GRIB_dataType :
- fc
- GRIB_gridDefinitionDescription :
- Latitude/Longitude Grid
- GRIB_gridType :
- regular_ll
- GRIB_iDirectionIncrementInDegrees :
- 0.25
- GRIB_iScansNegatively :
- 0
- GRIB_jDirectionIncrementInDegrees :
- 0.25
- GRIB_jPointsAreConsecutive :
- 0
- GRIB_jScansPositively :
- 0
- GRIB_latitudeOfFirstGridPointInDegrees :
- 90.0
- GRIB_latitudeOfLastGridPointInDegrees :
- -90.0
- GRIB_longitudeOfFirstGridPointInDegrees :
- 0.0
- GRIB_longitudeOfLastGridPointInDegrees :
- 359.75
- GRIB_missingValue :
- 3.4028234663852886e+38
- GRIB_name :
- Minimum total precipitation rate since previous post-processing
- GRIB_numberOfPoints :
- 1038240
- GRIB_paramId :
- 228227
- GRIB_shortName :
- mntpr
- GRIB_stepType :
- max
- GRIB_stepUnits :
- 1
- GRIB_totalNumber :
- 0
- GRIB_typeOfLevel :
- surface
- GRIB_units :
- kg m**-2 s**-1
- GRIB_uvRelativeToGrid :
- 0
- long_name :
- Minimum total precipitation rate since previous post-processing
- standard_name :
- unknown
- units :
- kg m**-2 s**-1
Array Chunk Bytes 2.86 TiB 67.50 MiB Shape (756768, 721, 1440) (4320, 64, 64) Dask graph 48576 chunks in 2 graph layers Data type float32 numpy.ndarray - msl(valid_time, latitude, longitude)float32dask.array<chunksize=(4320, 64, 64), meta=np.ndarray>
- GRIB_NV :
- 0
- GRIB_Nx :
- 1440
- GRIB_Ny :
- 721
- GRIB_cfName :
- air_pressure_at_mean_sea_level
- GRIB_cfVarName :
- msl
- GRIB_dataType :
- an
- GRIB_gridDefinitionDescription :
- Latitude/Longitude Grid
- GRIB_gridType :
- regular_ll
- GRIB_iDirectionIncrementInDegrees :
- 0.25
- GRIB_iScansNegatively :
- 0
- GRIB_jDirectionIncrementInDegrees :
- 0.25
- GRIB_jPointsAreConsecutive :
- 0
- GRIB_jScansPositively :
- 0
- GRIB_latitudeOfFirstGridPointInDegrees :
- 90.0
- GRIB_latitudeOfLastGridPointInDegrees :
- -90.0
- GRIB_longitudeOfFirstGridPointInDegrees :
- 0.0
- GRIB_longitudeOfLastGridPointInDegrees :
- 359.75
- GRIB_missingValue :
- 3.4028234663852886e+38
- GRIB_name :
- Mean sea level pressure
- GRIB_numberOfPoints :
- 1038240
- GRIB_paramId :
- 151
- GRIB_shortName :
- msl
- GRIB_stepType :
- instant
- GRIB_stepUnits :
- 1
- GRIB_totalNumber :
- 0
- GRIB_typeOfLevel :
- surface
- GRIB_units :
- Pa
- GRIB_uvRelativeToGrid :
- 0
- long_name :
- Mean sea level pressure
- standard_name :
- air_pressure_at_mean_sea_level
- units :
- Pa
Array Chunk Bytes 2.86 TiB 67.50 MiB Shape (756768, 721, 1440) (4320, 64, 64) Dask graph 48576 chunks in 2 graph layers Data type float32 numpy.ndarray - mx2t(valid_time, latitude, longitude)float32dask.array<chunksize=(4320, 64, 64), meta=np.ndarray>
- GRIB_NV :
- 0
- GRIB_Nx :
- 1440
- GRIB_Ny :
- 721
- GRIB_cfName :
- unknown
- GRIB_cfVarName :
- mx2t
- GRIB_dataType :
- fc
- GRIB_gridDefinitionDescription :
- Latitude/Longitude Grid
- GRIB_gridType :
- regular_ll
- GRIB_iDirectionIncrementInDegrees :
- 0.25
- GRIB_iScansNegatively :
- 0
- GRIB_jDirectionIncrementInDegrees :
- 0.25
- GRIB_jPointsAreConsecutive :
- 0
- GRIB_jScansPositively :
- 0
- GRIB_latitudeOfFirstGridPointInDegrees :
- 90.0
- GRIB_latitudeOfLastGridPointInDegrees :
- -90.0
- GRIB_longitudeOfFirstGridPointInDegrees :
- 0.0
- GRIB_longitudeOfLastGridPointInDegrees :
- 359.75
- GRIB_missingValue :
- 3.4028234663852886e+38
- GRIB_name :
- Maximum temperature at 2 metres since previous post-processing
- GRIB_numberOfPoints :
- 1038240
- GRIB_paramId :
- 201
- GRIB_shortName :
- mx2t
- GRIB_stepType :
- max
- GRIB_stepUnits :
- 1
- GRIB_totalNumber :
- 0
- GRIB_typeOfLevel :
- surface
- GRIB_units :
- K
- GRIB_uvRelativeToGrid :
- 0
- long_name :
- Maximum temperature at 2 metres since previous post-processing
- standard_name :
- unknown
- units :
- K
Array Chunk Bytes 2.86 TiB 67.50 MiB Shape (756768, 721, 1440) (4320, 64, 64) Dask graph 48576 chunks in 2 graph layers Data type float32 numpy.ndarray - mxtpr(valid_time, latitude, longitude)float32dask.array<chunksize=(4320, 64, 64), meta=np.ndarray>
- GRIB_NV :
- 0
- GRIB_Nx :
- 1440
- GRIB_Ny :
- 721
- GRIB_cfName :
- unknown
- GRIB_cfVarName :
- mxtpr
- GRIB_dataType :
- fc
- GRIB_gridDefinitionDescription :
- Latitude/Longitude Grid
- GRIB_gridType :
- regular_ll
- GRIB_iDirectionIncrementInDegrees :
- 0.25
- GRIB_iScansNegatively :
- 0
- GRIB_jDirectionIncrementInDegrees :
- 0.25
- GRIB_jPointsAreConsecutive :
- 0
- GRIB_jScansPositively :
- 0
- GRIB_latitudeOfFirstGridPointInDegrees :
- 90.0
- GRIB_latitudeOfLastGridPointInDegrees :
- -90.0
- GRIB_longitudeOfFirstGridPointInDegrees :
- 0.0
- GRIB_longitudeOfLastGridPointInDegrees :
- 359.75
- GRIB_missingValue :
- 3.4028234663852886e+38
- GRIB_name :
- Maximum total precipitation rate since previous post-processing
- GRIB_numberOfPoints :
- 1038240
- GRIB_paramId :
- 228226
- GRIB_shortName :
- mxtpr
- GRIB_stepType :
- max
- GRIB_stepUnits :
- 1
- GRIB_totalNumber :
- 0
- GRIB_typeOfLevel :
- surface
- GRIB_units :
- kg m**-2 s**-1
- GRIB_uvRelativeToGrid :
- 0
- long_name :
- Maximum total precipitation rate since previous post-processing
- standard_name :
- unknown
- units :
- kg m**-2 s**-1
Array Chunk Bytes 2.86 TiB 67.50 MiB Shape (756768, 721, 1440) (4320, 64, 64) Dask graph 48576 chunks in 2 graph layers Data type float32 numpy.ndarray - pev(valid_time, latitude, longitude)float32dask.array<chunksize=(4320, 64, 64), meta=np.ndarray>
- GRIB_NV :
- 0
- GRIB_Nx :
- 1440
- GRIB_Ny :
- 721
- GRIB_cfName :
- unknown
- GRIB_cfVarName :
- pev
- GRIB_dataType :
- fc
- GRIB_gridDefinitionDescription :
- Latitude/Longitude Grid
- GRIB_gridType :
- regular_ll
- GRIB_iDirectionIncrementInDegrees :
- 0.25
- GRIB_iScansNegatively :
- 0
- GRIB_jDirectionIncrementInDegrees :
- 0.25
- GRIB_jPointsAreConsecutive :
- 0
- GRIB_jScansPositively :
- 0
- GRIB_latitudeOfFirstGridPointInDegrees :
- 90.0
- GRIB_latitudeOfLastGridPointInDegrees :
- -90.0
- GRIB_longitudeOfFirstGridPointInDegrees :
- 0.0
- GRIB_longitudeOfLastGridPointInDegrees :
- 359.75
- GRIB_missingValue :
- 3.4028234663852886e+38
- GRIB_name :
- Potential evaporation
- GRIB_numberOfPoints :
- 1038240
- GRIB_paramId :
- 228251
- GRIB_shortName :
- pev
- GRIB_stepType :
- accum
- GRIB_stepUnits :
- 1
- GRIB_totalNumber :
- 0
- GRIB_typeOfLevel :
- surface
- GRIB_units :
- m
- GRIB_uvRelativeToGrid :
- 0
- long_name :
- Potential evaporation
- standard_name :
- unknown
- units :
- m
Array Chunk Bytes 2.86 TiB 67.50 MiB Shape (756768, 721, 1440) (4320, 64, 64) Dask graph 48576 chunks in 2 graph layers Data type float32 numpy.ndarray - ptype(valid_time, latitude, longitude)float32dask.array<chunksize=(4320, 64, 64), meta=np.ndarray>
- GRIB_NV :
- 0
- GRIB_Nx :
- 1440
- GRIB_Ny :
- 721
- GRIB_cfName :
- unknown
- GRIB_cfVarName :
- ptype
- GRIB_dataType :
- fc
- GRIB_gridDefinitionDescription :
- Latitude/longitude
- GRIB_gridType :
- regular_ll
- GRIB_iDirectionIncrementInDegrees :
- 0.25
- GRIB_iScansNegatively :
- 0
- GRIB_jDirectionIncrementInDegrees :
- 0.25
- GRIB_jPointsAreConsecutive :
- 0
- GRIB_jScansPositively :
- 0
- GRIB_latitudeOfFirstGridPointInDegrees :
- 90.0
- GRIB_latitudeOfLastGridPointInDegrees :
- -90.0
- GRIB_longitudeOfFirstGridPointInDegrees :
- 0.0
- GRIB_longitudeOfLastGridPointInDegrees :
- 359.75
- GRIB_missingValue :
- 3.4028234663852886e+38
- GRIB_name :
- Precipitation type
- GRIB_numberOfPoints :
- 1038240
- GRIB_paramId :
- 260015
- GRIB_shortName :
- ptype
- GRIB_stepType :
- instant
- GRIB_stepUnits :
- 1
- GRIB_typeOfLevel :
- surface
- GRIB_units :
- (Code table 4.201)
- GRIB_uvRelativeToGrid :
- 0
- long_name :
- Precipitation type
- standard_name :
- unknown
- units :
- (Code table 4.201)
Array Chunk Bytes 2.86 TiB 67.50 MiB Shape (756768, 721, 1440) (4320, 64, 64) Dask graph 48576 chunks in 2 graph layers Data type float32 numpy.ndarray - ro(valid_time, latitude, longitude)float32dask.array<chunksize=(4320, 64, 64), meta=np.ndarray>
- GRIB_NV :
- 0
- GRIB_Nx :
- 1440
- GRIB_Ny :
- 721
- GRIB_cfName :
- unknown
- GRIB_cfVarName :
- ro
- GRIB_dataType :
- fc
- GRIB_gridDefinitionDescription :
- Latitude/Longitude Grid
- GRIB_gridType :
- regular_ll
- GRIB_iDirectionIncrementInDegrees :
- 0.25
- GRIB_iScansNegatively :
- 0
- GRIB_jDirectionIncrementInDegrees :
- 0.25
- GRIB_jPointsAreConsecutive :
- 0
- GRIB_jScansPositively :
- 0
- GRIB_latitudeOfFirstGridPointInDegrees :
- 90.0
- GRIB_latitudeOfLastGridPointInDegrees :
- -90.0
- GRIB_longitudeOfFirstGridPointInDegrees :
- 0.0
- GRIB_longitudeOfLastGridPointInDegrees :
- 359.75
- GRIB_missingValue :
- 3.4028234663852886e+38
- GRIB_name :
- Runoff
- GRIB_numberOfPoints :
- 1038240
- GRIB_paramId :
- 205
- GRIB_shortName :
- ro
- GRIB_stepType :
- accum
- GRIB_stepUnits :
- 1
- GRIB_totalNumber :
- 0
- GRIB_typeOfLevel :
- surface
- GRIB_units :
- m
- GRIB_uvRelativeToGrid :
- 0
- long_name :
- Runoff
- standard_name :
- unknown
- units :
- m
Array Chunk Bytes 2.86 TiB 67.50 MiB Shape (756768, 721, 1440) (4320, 64, 64) Dask graph 48576 chunks in 2 graph layers Data type float32 numpy.ndarray - rsn(valid_time, latitude, longitude)float32dask.array<chunksize=(4320, 64, 64), meta=np.ndarray>
- GRIB_NV :
- 0
- GRIB_Nx :
- 1440
- GRIB_Ny :
- 721
- GRIB_cfName :
- unknown
- GRIB_cfVarName :
- rsn
- GRIB_dataType :
- an
- GRIB_gridDefinitionDescription :
- Latitude/Longitude Grid
- GRIB_gridType :
- regular_ll
- GRIB_iDirectionIncrementInDegrees :
- 0.25
- GRIB_iScansNegatively :
- 0
- GRIB_jDirectionIncrementInDegrees :
- 0.25
- GRIB_jPointsAreConsecutive :
- 0
- GRIB_jScansPositively :
- 0
- GRIB_latitudeOfFirstGridPointInDegrees :
- 90.0
- GRIB_latitudeOfLastGridPointInDegrees :
- -90.0
- GRIB_longitudeOfFirstGridPointInDegrees :
- 0.0
- GRIB_longitudeOfLastGridPointInDegrees :
- 359.75
- GRIB_missingValue :
- 3.4028234663852886e+38
- GRIB_name :
- Snow density
- GRIB_numberOfPoints :
- 1038240
- GRIB_paramId :
- 33
- GRIB_shortName :
- rsn
- GRIB_stepType :
- instant
- GRIB_stepUnits :
- 1
- GRIB_totalNumber :
- 0
- GRIB_typeOfLevel :
- surface
- GRIB_units :
- kg m**-3
- GRIB_uvRelativeToGrid :
- 0
- long_name :
- Snow density
- standard_name :
- unknown
- units :
- kg m**-3
Array Chunk Bytes 2.86 TiB 67.50 MiB Shape (756768, 721, 1440) (4320, 64, 64) Dask graph 48576 chunks in 2 graph layers Data type float32 numpy.ndarray - sd(valid_time, latitude, longitude)float32dask.array<chunksize=(4320, 64, 64), meta=np.ndarray>
- GRIB_NV :
- 0
- GRIB_Nx :
- 1440
- GRIB_Ny :
- 721
- GRIB_cfName :
- lwe_thickness_of_surface_snow_amount
- GRIB_cfVarName :
- sd
- GRIB_dataType :
- an
- GRIB_gridDefinitionDescription :
- Latitude/Longitude Grid
- GRIB_gridType :
- regular_ll
- GRIB_iDirectionIncrementInDegrees :
- 0.25
- GRIB_iScansNegatively :
- 0
- GRIB_jDirectionIncrementInDegrees :
- 0.25
- GRIB_jPointsAreConsecutive :
- 0
- GRIB_jScansPositively :
- 0
- GRIB_latitudeOfFirstGridPointInDegrees :
- 90.0
- GRIB_latitudeOfLastGridPointInDegrees :
- -90.0
- GRIB_longitudeOfFirstGridPointInDegrees :
- 0.0
- GRIB_longitudeOfLastGridPointInDegrees :
- 359.75
- GRIB_missingValue :
- 3.4028234663852886e+38
- GRIB_name :
- Snow depth
- GRIB_numberOfPoints :
- 1038240
- GRIB_paramId :
- 141
- GRIB_shortName :
- sd
- GRIB_stepType :
- instant
- GRIB_stepUnits :
- 1
- GRIB_totalNumber :
- 0
- GRIB_typeOfLevel :
- surface
- GRIB_units :
- m of water equivalent
- GRIB_uvRelativeToGrid :
- 0
- long_name :
- Snow depth
- standard_name :
- lwe_thickness_of_surface_snow_amount
- units :
- m of water equivalent
Array Chunk Bytes 2.86 TiB 67.50 MiB Shape (756768, 721, 1440) (4320, 64, 64) Dask graph 48576 chunks in 2 graph layers Data type float32 numpy.ndarray - sf(valid_time, latitude, longitude)float32dask.array<chunksize=(4320, 64, 64), meta=np.ndarray>
- GRIB_NV :
- 0
- GRIB_Nx :
- 1440
- GRIB_Ny :
- 721
- GRIB_cfName :
- lwe_thickness_of_snowfall_amount
- GRIB_cfVarName :
- sf
- GRIB_dataType :
- fc
- GRIB_gridDefinitionDescription :
- Latitude/Longitude Grid
- GRIB_gridType :
- regular_ll
- GRIB_iDirectionIncrementInDegrees :
- 0.25
- GRIB_iScansNegatively :
- 0
- GRIB_jDirectionIncrementInDegrees :
- 0.25
- GRIB_jPointsAreConsecutive :
- 0
- GRIB_jScansPositively :
- 0
- GRIB_latitudeOfFirstGridPointInDegrees :
- 90.0
- GRIB_latitudeOfLastGridPointInDegrees :
- -90.0
- GRIB_longitudeOfFirstGridPointInDegrees :
- 0.0
- GRIB_longitudeOfLastGridPointInDegrees :
- 359.75
- GRIB_missingValue :
- 3.4028234663852886e+38
- GRIB_name :
- Snowfall
- GRIB_numberOfPoints :
- 1038240
- GRIB_paramId :
- 144
- GRIB_shortName :
- sf
- GRIB_stepType :
- accum
- GRIB_stepUnits :
- 1
- GRIB_totalNumber :
- 0
- GRIB_typeOfLevel :
- surface
- GRIB_units :
- m of water equivalent
- GRIB_uvRelativeToGrid :
- 0
- long_name :
- Snowfall
- standard_name :
- lwe_thickness_of_snowfall_amount
- units :
- m of water equivalent
Array Chunk Bytes 2.86 TiB 67.50 MiB Shape (756768, 721, 1440) (4320, 64, 64) Dask graph 48576 chunks in 2 graph layers Data type float32 numpy.ndarray - skt(valid_time, latitude, longitude)float32dask.array<chunksize=(4320, 64, 64), meta=np.ndarray>
- GRIB_NV :
- 0
- GRIB_Nx :
- 1440
- GRIB_Ny :
- 721
- GRIB_cfName :
- unknown
- GRIB_cfVarName :
- skt
- GRIB_dataType :
- an
- GRIB_gridDefinitionDescription :
- Latitude/Longitude Grid
- GRIB_gridType :
- regular_ll
- GRIB_iDirectionIncrementInDegrees :
- 0.25
- GRIB_iScansNegatively :
- 0
- GRIB_jDirectionIncrementInDegrees :
- 0.25
- GRIB_jPointsAreConsecutive :
- 0
- GRIB_jScansPositively :
- 0
- GRIB_latitudeOfFirstGridPointInDegrees :
- 90.0
- GRIB_latitudeOfLastGridPointInDegrees :
- -90.0
- GRIB_longitudeOfFirstGridPointInDegrees :
- 0.0
- GRIB_longitudeOfLastGridPointInDegrees :
- 359.75
- GRIB_missingValue :
- 3.4028234663852886e+38
- GRIB_name :
- Skin temperature
- GRIB_numberOfPoints :
- 1038240
- GRIB_paramId :
- 235
- GRIB_shortName :
- skt
- GRIB_stepType :
- instant
- GRIB_stepUnits :
- 1
- GRIB_totalNumber :
- 0
- GRIB_typeOfLevel :
- surface
- GRIB_units :
- K
- GRIB_uvRelativeToGrid :
- 0
- long_name :
- Skin temperature
- standard_name :
- unknown
- units :
- K
Array Chunk Bytes 2.86 TiB 67.50 MiB Shape (756768, 721, 1440) (4320, 64, 64) Dask graph 48576 chunks in 2 graph layers Data type float32 numpy.ndarray - slhf(valid_time, latitude, longitude)float32dask.array<chunksize=(4320, 64, 64), meta=np.ndarray>
- GRIB_NV :
- 0
- GRIB_Nx :
- 1440
- GRIB_Ny :
- 721
- GRIB_cfName :
- surface_upward_latent_heat_flux
- GRIB_cfVarName :
- slhf
- GRIB_dataType :
- fc
- GRIB_gridDefinitionDescription :
- Latitude/Longitude Grid
- GRIB_gridType :
- regular_ll
- GRIB_iDirectionIncrementInDegrees :
- 0.25
- GRIB_iScansNegatively :
- 0
- GRIB_jDirectionIncrementInDegrees :
- 0.25
- GRIB_jPointsAreConsecutive :
- 0
- GRIB_jScansPositively :
- 0
- GRIB_latitudeOfFirstGridPointInDegrees :
- 90.0
- GRIB_latitudeOfLastGridPointInDegrees :
- -90.0
- GRIB_longitudeOfFirstGridPointInDegrees :
- 0.0
- GRIB_longitudeOfLastGridPointInDegrees :
- 359.75
- GRIB_missingValue :
- 3.4028234663852886e+38
- GRIB_name :
- Time-integrated surface latent heat net flux
- GRIB_numberOfPoints :
- 1038240
- GRIB_paramId :
- 147
- GRIB_shortName :
- slhf
- GRIB_stepType :
- accum
- GRIB_stepUnits :
- 1
- GRIB_totalNumber :
- 0
- GRIB_typeOfLevel :
- surface
- GRIB_units :
- J m**-2
- GRIB_uvRelativeToGrid :
- 0
- long_name :
- Time-integrated surface latent heat net flux
- standard_name :
- surface_upward_latent_heat_flux
- units :
- J m**-2
Array Chunk Bytes 2.86 TiB 67.50 MiB Shape (756768, 721, 1440) (4320, 64, 64) Dask graph 48576 chunks in 2 graph layers Data type float32 numpy.ndarray - slt(valid_time, latitude, longitude)float32dask.array<chunksize=(4320, 64, 64), meta=np.ndarray>
- GRIB_NV :
- 0
- GRIB_Nx :
- 1440
- GRIB_Ny :
- 721
- GRIB_cfName :
- unknown
- GRIB_cfVarName :
- slt
- GRIB_dataType :
- an
- GRIB_gridDefinitionDescription :
- Latitude/Longitude Grid
- GRIB_gridType :
- regular_ll
- GRIB_iDirectionIncrementInDegrees :
- 0.25
- GRIB_iScansNegatively :
- 0
- GRIB_jDirectionIncrementInDegrees :
- 0.25
- GRIB_jPointsAreConsecutive :
- 0
- GRIB_jScansPositively :
- 0
- GRIB_latitudeOfFirstGridPointInDegrees :
- 90.0
- GRIB_latitudeOfLastGridPointInDegrees :
- -90.0
- GRIB_longitudeOfFirstGridPointInDegrees :
- 0.0
- GRIB_longitudeOfLastGridPointInDegrees :
- 359.75
- GRIB_missingValue :
- 3.4028234663852886e+38
- GRIB_name :
- Soil type
- GRIB_numberOfPoints :
- 1038240
- GRIB_paramId :
- 43
- GRIB_shortName :
- slt
- GRIB_stepType :
- instant
- GRIB_stepUnits :
- 1
- GRIB_totalNumber :
- 0
- GRIB_typeOfLevel :
- surface
- GRIB_units :
- (Code table 4.213)
- GRIB_uvRelativeToGrid :
- 0
- long_name :
- Soil type
- standard_name :
- unknown
- units :
- (Code table 4.213)
Array Chunk Bytes 2.86 TiB 67.50 MiB Shape (756768, 721, 1440) (4320, 64, 64) Dask graph 48576 chunks in 2 graph layers Data type float32 numpy.ndarray - smlt(valid_time, latitude, longitude)float32dask.array<chunksize=(4320, 64, 64), meta=np.ndarray>
- GRIB_NV :
- 0
- GRIB_Nx :
- 1440
- GRIB_Ny :
- 721
- GRIB_cfName :
- unknown
- GRIB_cfVarName :
- smlt
- GRIB_dataType :
- fc
- GRIB_gridDefinitionDescription :
- Latitude/Longitude Grid
- GRIB_gridType :
- regular_ll
- GRIB_iDirectionIncrementInDegrees :
- 0.25
- GRIB_iScansNegatively :
- 0
- GRIB_jDirectionIncrementInDegrees :
- 0.25
- GRIB_jPointsAreConsecutive :
- 0
- GRIB_jScansPositively :
- 0
- GRIB_latitudeOfFirstGridPointInDegrees :
- 90.0
- GRIB_latitudeOfLastGridPointInDegrees :
- -90.0
- GRIB_longitudeOfFirstGridPointInDegrees :
- 0.0
- GRIB_longitudeOfLastGridPointInDegrees :
- 359.75
- GRIB_missingValue :
- 3.4028234663852886e+38
- GRIB_name :
- Snowmelt
- GRIB_numberOfPoints :
- 1038240
- GRIB_paramId :
- 45
- GRIB_shortName :
- smlt
- GRIB_stepType :
- accum
- GRIB_stepUnits :
- 1
- GRIB_totalNumber :
- 0
- GRIB_typeOfLevel :
- surface
- GRIB_units :
- m of water equivalent
- GRIB_uvRelativeToGrid :
- 0
- long_name :
- Snowmelt
- standard_name :
- unknown
- units :
- m of water equivalent
Array Chunk Bytes 2.86 TiB 67.50 MiB Shape (756768, 721, 1440) (4320, 64, 64) Dask graph 48576 chunks in 2 graph layers Data type float32 numpy.ndarray - sp(valid_time, latitude, longitude)float32dask.array<chunksize=(4320, 64, 64), meta=np.ndarray>
- GRIB_NV :
- 0
- GRIB_Nx :
- 1440
- GRIB_Ny :
- 721
- GRIB_cfName :
- surface_air_pressure
- GRIB_cfVarName :
- sp
- GRIB_dataType :
- an
- GRIB_gridDefinitionDescription :
- Latitude/Longitude Grid
- GRIB_gridType :
- regular_ll
- GRIB_iDirectionIncrementInDegrees :
- 0.25
- GRIB_iScansNegatively :
- 0
- GRIB_jDirectionIncrementInDegrees :
- 0.25
- GRIB_jPointsAreConsecutive :
- 0
- GRIB_jScansPositively :
- 0
- GRIB_latitudeOfFirstGridPointInDegrees :
- 90.0
- GRIB_latitudeOfLastGridPointInDegrees :
- -90.0
- GRIB_longitudeOfFirstGridPointInDegrees :
- 0.0
- GRIB_longitudeOfLastGridPointInDegrees :
- 359.75
- GRIB_missingValue :
- 3.4028234663852886e+38
- GRIB_name :
- Surface pressure
- GRIB_numberOfPoints :
- 1038240
- GRIB_paramId :
- 134
- GRIB_shortName :
- sp
- GRIB_stepType :
- instant
- GRIB_stepUnits :
- 1
- GRIB_totalNumber :
- 0
- GRIB_typeOfLevel :
- surface
- GRIB_units :
- Pa
- GRIB_uvRelativeToGrid :
- 0
- long_name :
- Surface pressure
- standard_name :
- surface_air_pressure
- units :
- Pa
Array Chunk Bytes 2.86 TiB 67.50 MiB Shape (756768, 721, 1440) (4320, 64, 64) Dask graph 48576 chunks in 2 graph layers Data type float32 numpy.ndarray - sro(valid_time, latitude, longitude)float32dask.array<chunksize=(4320, 64, 64), meta=np.ndarray>
- GRIB_NV :
- 0
- GRIB_Nx :
- 1440
- GRIB_Ny :
- 721
- GRIB_cfName :
- unknown
- GRIB_cfVarName :
- sro
- GRIB_dataType :
- fc
- GRIB_gridDefinitionDescription :
- Latitude/Longitude Grid
- GRIB_gridType :
- regular_ll
- GRIB_iDirectionIncrementInDegrees :
- 0.25
- GRIB_iScansNegatively :
- 0
- GRIB_jDirectionIncrementInDegrees :
- 0.25
- GRIB_jPointsAreConsecutive :
- 0
- GRIB_jScansPositively :
- 0
- GRIB_latitudeOfFirstGridPointInDegrees :
- 90.0
- GRIB_latitudeOfLastGridPointInDegrees :
- -90.0
- GRIB_longitudeOfFirstGridPointInDegrees :
- 0.0
- GRIB_longitudeOfLastGridPointInDegrees :
- 359.75
- GRIB_missingValue :
- 3.4028234663852886e+38
- GRIB_name :
- Surface runoff
- GRIB_numberOfPoints :
- 1038240
- GRIB_paramId :
- 8
- GRIB_shortName :
- sro
- GRIB_stepType :
- accum
- GRIB_stepUnits :
- 1
- GRIB_totalNumber :
- 0
- GRIB_typeOfLevel :
- surface
- GRIB_units :
- m
- GRIB_uvRelativeToGrid :
- 0
- long_name :
- Surface runoff
- standard_name :
- unknown
- units :
- m
Array Chunk Bytes 2.86 TiB 67.50 MiB Shape (756768, 721, 1440) (4320, 64, 64) Dask graph 48576 chunks in 2 graph layers Data type float32 numpy.ndarray - sshf(valid_time, latitude, longitude)float32dask.array<chunksize=(4320, 64, 64), meta=np.ndarray>
- GRIB_NV :
- 0
- GRIB_Nx :
- 1440
- GRIB_Ny :
- 721
- GRIB_cfName :
- surface_upward_sensible_heat_flux
- GRIB_cfVarName :
- sshf
- GRIB_dataType :
- fc
- GRIB_gridDefinitionDescription :
- Latitude/Longitude Grid
- GRIB_gridType :
- regular_ll
- GRIB_iDirectionIncrementInDegrees :
- 0.25
- GRIB_iScansNegatively :
- 0
- GRIB_jDirectionIncrementInDegrees :
- 0.25
- GRIB_jPointsAreConsecutive :
- 0
- GRIB_jScansPositively :
- 0
- GRIB_latitudeOfFirstGridPointInDegrees :
- 90.0
- GRIB_latitudeOfLastGridPointInDegrees :
- -90.0
- GRIB_longitudeOfFirstGridPointInDegrees :
- 0.0
- GRIB_longitudeOfLastGridPointInDegrees :
- 359.75
- GRIB_missingValue :
- 3.4028234663852886e+38
- GRIB_name :
- Time-integrated surface sensible heat net flux
- GRIB_numberOfPoints :
- 1038240
- GRIB_paramId :
- 146
- GRIB_shortName :
- sshf
- GRIB_stepType :
- accum
- GRIB_stepUnits :
- 1
- GRIB_totalNumber :
- 0
- GRIB_typeOfLevel :
- surface
- GRIB_units :
- J m**-2
- GRIB_uvRelativeToGrid :
- 0
- long_name :
- Time-integrated surface sensible heat net flux
- standard_name :
- surface_upward_sensible_heat_flux
- units :
- J m**-2
Array Chunk Bytes 2.86 TiB 67.50 MiB Shape (756768, 721, 1440) (4320, 64, 64) Dask graph 48576 chunks in 2 graph layers Data type float32 numpy.ndarray - ssr(valid_time, latitude, longitude)float32dask.array<chunksize=(4320, 64, 64), meta=np.ndarray>
- GRIB_NV :
- 0
- GRIB_Nx :
- 1440
- GRIB_Ny :
- 721
- GRIB_cfName :
- surface_net_downward_shortwave_flux
- GRIB_cfVarName :
- ssr
- GRIB_dataType :
- fc
- GRIB_gridDefinitionDescription :
- Latitude/Longitude Grid
- GRIB_gridType :
- regular_ll
- GRIB_iDirectionIncrementInDegrees :
- 0.25
- GRIB_iScansNegatively :
- 0
- GRIB_jDirectionIncrementInDegrees :
- 0.25
- GRIB_jPointsAreConsecutive :
- 0
- GRIB_jScansPositively :
- 0
- GRIB_latitudeOfFirstGridPointInDegrees :
- 90.0
- GRIB_latitudeOfLastGridPointInDegrees :
- -90.0
- GRIB_longitudeOfFirstGridPointInDegrees :
- 0.0
- GRIB_longitudeOfLastGridPointInDegrees :
- 359.75
- GRIB_missingValue :
- 3.4028234663852886e+38
- GRIB_name :
- Surface net short-wave (solar) radiation
- GRIB_numberOfPoints :
- 1038240
- GRIB_paramId :
- 176
- GRIB_shortName :
- ssr
- GRIB_stepType :
- accum
- GRIB_stepUnits :
- 1
- GRIB_totalNumber :
- 0
- GRIB_typeOfLevel :
- surface
- GRIB_units :
- J m**-2
- GRIB_uvRelativeToGrid :
- 0
- long_name :
- Surface net short-wave (solar) radiation
- standard_name :
- surface_net_downward_shortwave_flux
- units :
- J m**-2
Array Chunk Bytes 2.86 TiB 67.50 MiB Shape (756768, 721, 1440) (4320, 64, 64) Dask graph 48576 chunks in 2 graph layers Data type float32 numpy.ndarray - ssrc(valid_time, latitude, longitude)float32dask.array<chunksize=(4320, 64, 64), meta=np.ndarray>
- GRIB_NV :
- 0
- GRIB_Nx :
- 1440
- GRIB_Ny :
- 721
- GRIB_cfName :
- surface_net_downward_shortwave_flux_assuming_clear_sky
- GRIB_cfVarName :
- ssrc
- GRIB_dataType :
- fc
- GRIB_gridDefinitionDescription :
- Latitude/Longitude Grid
- GRIB_gridType :
- regular_ll
- GRIB_iDirectionIncrementInDegrees :
- 0.25
- GRIB_iScansNegatively :
- 0
- GRIB_jDirectionIncrementInDegrees :
- 0.25
- GRIB_jPointsAreConsecutive :
- 0
- GRIB_jScansPositively :
- 0
- GRIB_latitudeOfFirstGridPointInDegrees :
- 90.0
- GRIB_latitudeOfLastGridPointInDegrees :
- -90.0
- GRIB_longitudeOfFirstGridPointInDegrees :
- 0.0
- GRIB_longitudeOfLastGridPointInDegrees :
- 359.75
- GRIB_missingValue :
- 3.4028234663852886e+38
- GRIB_name :
- Surface net short-wave (solar) radiation, clear sky
- GRIB_numberOfPoints :
- 1038240
- GRIB_paramId :
- 210
- GRIB_shortName :
- ssrc
- GRIB_stepType :
- accum
- GRIB_stepUnits :
- 1
- GRIB_totalNumber :
- 0
- GRIB_typeOfLevel :
- surface
- GRIB_units :
- J m**-2
- GRIB_uvRelativeToGrid :
- 0
- long_name :
- Surface net short-wave (solar) radiation, clear sky
- standard_name :
- surface_net_downward_shortwave_flux_assuming_clear_sky
- units :
- J m**-2
Array Chunk Bytes 2.86 TiB 67.50 MiB Shape (756768, 721, 1440) (4320, 64, 64) Dask graph 48576 chunks in 2 graph layers Data type float32 numpy.ndarray - ssrd(valid_time, latitude, longitude)float32dask.array<chunksize=(4320, 64, 64), meta=np.ndarray>
- GRIB_NV :
- 0
- GRIB_Nx :
- 1440
- GRIB_Ny :
- 721
- GRIB_cfName :
- surface_downwelling_shortwave_flux_in_air
- GRIB_cfVarName :
- ssrd
- GRIB_dataType :
- fc
- GRIB_gridDefinitionDescription :
- Latitude/Longitude Grid
- GRIB_gridType :
- regular_ll
- GRIB_iDirectionIncrementInDegrees :
- 0.25
- GRIB_iScansNegatively :
- 0
- GRIB_jDirectionIncrementInDegrees :
- 0.25
- GRIB_jPointsAreConsecutive :
- 0
- GRIB_jScansPositively :
- 0
- GRIB_latitudeOfFirstGridPointInDegrees :
- 90.0
- GRIB_latitudeOfLastGridPointInDegrees :
- -90.0
- GRIB_longitudeOfFirstGridPointInDegrees :
- 0.0
- GRIB_longitudeOfLastGridPointInDegrees :
- 359.75
- GRIB_missingValue :
- 3.4028234663852886e+38
- GRIB_name :
- Surface short-wave (solar) radiation downwards
- GRIB_numberOfPoints :
- 1038240
- GRIB_paramId :
- 169
- GRIB_shortName :
- ssrd
- GRIB_stepType :
- accum
- GRIB_stepUnits :
- 1
- GRIB_totalNumber :
- 0
- GRIB_typeOfLevel :
- surface
- GRIB_units :
- J m**-2
- GRIB_uvRelativeToGrid :
- 0
- long_name :
- Surface short-wave (solar) radiation downwards
- standard_name :
- surface_downwelling_shortwave_flux_in_air
- units :
- J m**-2
Array Chunk Bytes 2.86 TiB 67.50 MiB Shape (756768, 721, 1440) (4320, 64, 64) Dask graph 48576 chunks in 2 graph layers Data type float32 numpy.ndarray - ssrdc(valid_time, latitude, longitude)float32dask.array<chunksize=(4320, 64, 64), meta=np.ndarray>
- GRIB_NV :
- 0
- GRIB_Nx :
- 1440
- GRIB_Ny :
- 721
- GRIB_cfName :
- unknown
- GRIB_cfVarName :
- ssrdc
- GRIB_dataType :
- fc
- GRIB_gridDefinitionDescription :
- Latitude/Longitude Grid
- GRIB_gridType :
- regular_ll
- GRIB_iDirectionIncrementInDegrees :
- 0.25
- GRIB_iScansNegatively :
- 0
- GRIB_jDirectionIncrementInDegrees :
- 0.25
- GRIB_jPointsAreConsecutive :
- 0
- GRIB_jScansPositively :
- 0
- GRIB_latitudeOfFirstGridPointInDegrees :
- 90.0
- GRIB_latitudeOfLastGridPointInDegrees :
- -90.0
- GRIB_longitudeOfFirstGridPointInDegrees :
- 0.0
- GRIB_longitudeOfLastGridPointInDegrees :
- 359.75
- GRIB_missingValue :
- 3.4028234663852886e+38
- GRIB_name :
- Surface short-wave (solar) radiation downward clear-sky
- GRIB_numberOfPoints :
- 1038240
- GRIB_paramId :
- 228129
- GRIB_shortName :
- ssrdc
- GRIB_stepType :
- accum
- GRIB_stepUnits :
- 1
- GRIB_totalNumber :
- 0
- GRIB_typeOfLevel :
- surface
- GRIB_units :
- J m**-2
- GRIB_uvRelativeToGrid :
- 0
- long_name :
- Surface short-wave (solar) radiation downward clear-sky
- standard_name :
- unknown
- units :
- J m**-2
Array Chunk Bytes 2.86 TiB 67.50 MiB Shape (756768, 721, 1440) (4320, 64, 64) Dask graph 48576 chunks in 2 graph layers Data type float32 numpy.ndarray - ssro(valid_time, latitude, longitude)float32dask.array<chunksize=(4320, 64, 64), meta=np.ndarray>
- GRIB_NV :
- 0
- GRIB_Nx :
- 1440
- GRIB_Ny :
- 721
- GRIB_cfName :
- unknown
- GRIB_cfVarName :
- ssro
- GRIB_dataType :
- fc
- GRIB_gridDefinitionDescription :
- Latitude/Longitude Grid
- GRIB_gridType :
- regular_ll
- GRIB_iDirectionIncrementInDegrees :
- 0.25
- GRIB_iScansNegatively :
- 0
- GRIB_jDirectionIncrementInDegrees :
- 0.25
- GRIB_jPointsAreConsecutive :
- 0
- GRIB_jScansPositively :
- 0
- GRIB_latitudeOfFirstGridPointInDegrees :
- 90.0
- GRIB_latitudeOfLastGridPointInDegrees :
- -90.0
- GRIB_longitudeOfFirstGridPointInDegrees :
- 0.0
- GRIB_longitudeOfLastGridPointInDegrees :
- 359.75
- GRIB_missingValue :
- 3.4028234663852886e+38
- GRIB_name :
- Sub-surface runoff
- GRIB_numberOfPoints :
- 1038240
- GRIB_paramId :
- 9
- GRIB_shortName :
- ssro
- GRIB_stepType :
- accum
- GRIB_stepUnits :
- 1
- GRIB_totalNumber :
- 0
- GRIB_typeOfLevel :
- surface
- GRIB_units :
- m
- GRIB_uvRelativeToGrid :
- 0
- long_name :
- Sub-surface runoff
- standard_name :
- unknown
- units :
- m
Array Chunk Bytes 2.86 TiB 67.50 MiB Shape (756768, 721, 1440) (4320, 64, 64) Dask graph 48576 chunks in 2 graph layers Data type float32 numpy.ndarray - sst(valid_time, latitude, longitude)float32dask.array<chunksize=(4320, 64, 64), meta=np.ndarray>
- GRIB_NV :
- 0
- GRIB_Nx :
- 1440
- GRIB_Ny :
- 721
- GRIB_cfName :
- unknown
- GRIB_cfVarName :
- sst
- GRIB_dataType :
- an
- GRIB_gridDefinitionDescription :
- Latitude/Longitude Grid
- GRIB_gridType :
- regular_ll
- GRIB_iDirectionIncrementInDegrees :
- 0.25
- GRIB_iScansNegatively :
- 0
- GRIB_jDirectionIncrementInDegrees :
- 0.25
- GRIB_jPointsAreConsecutive :
- 0
- GRIB_jScansPositively :
- 0
- GRIB_latitudeOfFirstGridPointInDegrees :
- 90.0
- GRIB_latitudeOfLastGridPointInDegrees :
- -90.0
- GRIB_longitudeOfFirstGridPointInDegrees :
- 0.0
- GRIB_longitudeOfLastGridPointInDegrees :
- 359.75
- GRIB_missingValue :
- 3.4028234663852886e+38
- GRIB_name :
- Sea surface temperature
- GRIB_numberOfPoints :
- 1038240
- GRIB_paramId :
- 34
- GRIB_shortName :
- sst
- GRIB_stepType :
- instant
- GRIB_stepUnits :
- 1
- GRIB_typeOfLevel :
- surface
- GRIB_units :
- K
- GRIB_uvRelativeToGrid :
- 0
- long_name :
- Sea surface temperature
- standard_name :
- unknown
- units :
- K
Array Chunk Bytes 2.86 TiB 67.50 MiB Shape (756768, 721, 1440) (4320, 64, 64) Dask graph 48576 chunks in 2 graph layers Data type float32 numpy.ndarray - stl1(valid_time, latitude, longitude)float32dask.array<chunksize=(4320, 64, 64), meta=np.ndarray>
- GRIB_NV :
- 0
- GRIB_Nx :
- 1440
- GRIB_Ny :
- 721
- GRIB_cfName :
- surface_temperature
- GRIB_cfVarName :
- stl1
- GRIB_dataType :
- an
- GRIB_gridDefinitionDescription :
- Latitude/Longitude Grid
- GRIB_gridType :
- regular_ll
- GRIB_iDirectionIncrementInDegrees :
- 0.25
- GRIB_iScansNegatively :
- 0
- GRIB_jDirectionIncrementInDegrees :
- 0.25
- GRIB_jPointsAreConsecutive :
- 0
- GRIB_jScansPositively :
- 0
- GRIB_latitudeOfFirstGridPointInDegrees :
- 90.0
- GRIB_latitudeOfLastGridPointInDegrees :
- -90.0
- GRIB_longitudeOfFirstGridPointInDegrees :
- 0.0
- GRIB_longitudeOfLastGridPointInDegrees :
- 359.75
- GRIB_missingValue :
- 3.4028234663852886e+38
- GRIB_name :
- Soil temperature level 1
- GRIB_numberOfPoints :
- 1038240
- GRIB_paramId :
- 139
- GRIB_shortName :
- stl1
- GRIB_stepType :
- instant
- GRIB_stepUnits :
- 1
- GRIB_totalNumber :
- 0
- GRIB_typeOfLevel :
- depthBelowLandLayer
- GRIB_units :
- K
- GRIB_uvRelativeToGrid :
- 0
- long_name :
- Soil temperature level 1
- standard_name :
- surface_temperature
- units :
- K
Array Chunk Bytes 2.86 TiB 67.50 MiB Shape (756768, 721, 1440) (4320, 64, 64) Dask graph 48576 chunks in 2 graph layers Data type float32 numpy.ndarray - stl2(valid_time, latitude, longitude)float32dask.array<chunksize=(4320, 64, 64), meta=np.ndarray>
- GRIB_NV :
- 0
- GRIB_Nx :
- 1440
- GRIB_Ny :
- 721
- GRIB_cfName :
- unknown
- GRIB_cfVarName :
- stl2
- GRIB_dataType :
- an
- GRIB_gridDefinitionDescription :
- Latitude/Longitude Grid
- GRIB_gridType :
- regular_ll
- GRIB_iDirectionIncrementInDegrees :
- 0.25
- GRIB_iScansNegatively :
- 0
- GRIB_jDirectionIncrementInDegrees :
- 0.25
- GRIB_jPointsAreConsecutive :
- 0
- GRIB_jScansPositively :
- 0
- GRIB_latitudeOfFirstGridPointInDegrees :
- 90.0
- GRIB_latitudeOfLastGridPointInDegrees :
- -90.0
- GRIB_longitudeOfFirstGridPointInDegrees :
- 0.0
- GRIB_longitudeOfLastGridPointInDegrees :
- 359.75
- GRIB_missingValue :
- 3.4028234663852886e+38
- GRIB_name :
- Soil temperature level 2
- GRIB_numberOfPoints :
- 1038240
- GRIB_paramId :
- 170
- GRIB_shortName :
- stl2
- GRIB_stepType :
- instant
- GRIB_stepUnits :
- 1
- GRIB_totalNumber :
- 0
- GRIB_typeOfLevel :
- depthBelowLandLayer
- GRIB_units :
- K
- GRIB_uvRelativeToGrid :
- 0
- long_name :
- Soil temperature level 2
- standard_name :
- unknown
- units :
- K
Array Chunk Bytes 2.86 TiB 67.50 MiB Shape (756768, 721, 1440) (4320, 64, 64) Dask graph 48576 chunks in 2 graph layers Data type float32 numpy.ndarray - stl3(valid_time, latitude, longitude)float32dask.array<chunksize=(4320, 64, 64), meta=np.ndarray>
- GRIB_NV :
- 0
- GRIB_Nx :
- 1440
- GRIB_Ny :
- 721
- GRIB_cfName :
- unknown
- GRIB_cfVarName :
- stl3
- GRIB_dataType :
- an
- GRIB_gridDefinitionDescription :
- Latitude/Longitude Grid
- GRIB_gridType :
- regular_ll
- GRIB_iDirectionIncrementInDegrees :
- 0.25
- GRIB_iScansNegatively :
- 0
- GRIB_jDirectionIncrementInDegrees :
- 0.25
- GRIB_jPointsAreConsecutive :
- 0
- GRIB_jScansPositively :
- 0
- GRIB_latitudeOfFirstGridPointInDegrees :
- 90.0
- GRIB_latitudeOfLastGridPointInDegrees :
- -90.0
- GRIB_longitudeOfFirstGridPointInDegrees :
- 0.0
- GRIB_longitudeOfLastGridPointInDegrees :
- 359.75
- GRIB_missingValue :
- 3.4028234663852886e+38
- GRIB_name :
- Soil temperature level 3
- GRIB_numberOfPoints :
- 1038240
- GRIB_paramId :
- 183
- GRIB_shortName :
- stl3
- GRIB_stepType :
- instant
- GRIB_stepUnits :
- 1
- GRIB_totalNumber :
- 0
- GRIB_typeOfLevel :
- depthBelowLandLayer
- GRIB_units :
- K
- GRIB_uvRelativeToGrid :
- 0
- long_name :
- Soil temperature level 3
- standard_name :
- unknown
- units :
- K
Array Chunk Bytes 2.86 TiB 67.50 MiB Shape (756768, 721, 1440) (4320, 64, 64) Dask graph 48576 chunks in 2 graph layers Data type float32 numpy.ndarray - stl4(valid_time, latitude, longitude)float32dask.array<chunksize=(4320, 64, 64), meta=np.ndarray>
- GRIB_NV :
- 0
- GRIB_Nx :
- 1440
- GRIB_Ny :
- 721
- GRIB_cfName :
- unknown
- GRIB_cfVarName :
- stl4
- GRIB_dataType :
- an
- GRIB_gridDefinitionDescription :
- Latitude/Longitude Grid
- GRIB_gridType :
- regular_ll
- GRIB_iDirectionIncrementInDegrees :
- 0.25
- GRIB_iScansNegatively :
- 0
- GRIB_jDirectionIncrementInDegrees :
- 0.25
- GRIB_jPointsAreConsecutive :
- 0
- GRIB_jScansPositively :
- 0
- GRIB_latitudeOfFirstGridPointInDegrees :
- 90.0
- GRIB_latitudeOfLastGridPointInDegrees :
- -90.0
- GRIB_longitudeOfFirstGridPointInDegrees :
- 0.0
- GRIB_longitudeOfLastGridPointInDegrees :
- 359.75
- GRIB_missingValue :
- 3.4028234663852886e+38
- GRIB_name :
- Soil temperature level 4
- GRIB_numberOfPoints :
- 1038240
- GRIB_paramId :
- 236
- GRIB_shortName :
- stl4
- GRIB_stepType :
- instant
- GRIB_stepUnits :
- 1
- GRIB_totalNumber :
- 0
- GRIB_typeOfLevel :
- depthBelowLandLayer
- GRIB_units :
- K
- GRIB_uvRelativeToGrid :
- 0
- long_name :
- Soil temperature level 4
- standard_name :
- unknown
- units :
- K
Array Chunk Bytes 2.86 TiB 67.50 MiB Shape (756768, 721, 1440) (4320, 64, 64) Dask graph 48576 chunks in 2 graph layers Data type float32 numpy.ndarray - str(valid_time, latitude, longitude)float32dask.array<chunksize=(4320, 64, 64), meta=np.ndarray>
- GRIB_NV :
- 0
- GRIB_Nx :
- 1440
- GRIB_Ny :
- 721
- GRIB_cfName :
- surface_net_upward_longwave_flux
- GRIB_cfVarName :
- str
- GRIB_dataType :
- fc
- GRIB_gridDefinitionDescription :
- Latitude/Longitude Grid
- GRIB_gridType :
- regular_ll
- GRIB_iDirectionIncrementInDegrees :
- 0.25
- GRIB_iScansNegatively :
- 0
- GRIB_jDirectionIncrementInDegrees :
- 0.25
- GRIB_jPointsAreConsecutive :
- 0
- GRIB_jScansPositively :
- 0
- GRIB_latitudeOfFirstGridPointInDegrees :
- 90.0
- GRIB_latitudeOfLastGridPointInDegrees :
- -90.0
- GRIB_longitudeOfFirstGridPointInDegrees :
- 0.0
- GRIB_longitudeOfLastGridPointInDegrees :
- 359.75
- GRIB_missingValue :
- 3.4028234663852886e+38
- GRIB_name :
- Surface net long-wave (thermal) radiation
- GRIB_numberOfPoints :
- 1038240
- GRIB_paramId :
- 177
- GRIB_shortName :
- str
- GRIB_stepType :
- accum
- GRIB_stepUnits :
- 1
- GRIB_totalNumber :
- 0
- GRIB_typeOfLevel :
- surface
- GRIB_units :
- J m**-2
- GRIB_uvRelativeToGrid :
- 0
- long_name :
- Surface net long-wave (thermal) radiation
- standard_name :
- surface_net_upward_longwave_flux
- units :
- J m**-2
Array Chunk Bytes 2.86 TiB 67.50 MiB Shape (756768, 721, 1440) (4320, 64, 64) Dask graph 48576 chunks in 2 graph layers Data type float32 numpy.ndarray - strc(valid_time, latitude, longitude)float32dask.array<chunksize=(4320, 64, 64), meta=np.ndarray>
- GRIB_NV :
- 0
- GRIB_Nx :
- 1440
- GRIB_Ny :
- 721
- GRIB_cfName :
- surface_net_downward_longwave_flux_assuming_clear_sky
- GRIB_cfVarName :
- strc
- GRIB_dataType :
- fc
- GRIB_gridDefinitionDescription :
- Latitude/Longitude Grid
- GRIB_gridType :
- regular_ll
- GRIB_iDirectionIncrementInDegrees :
- 0.25
- GRIB_iScansNegatively :
- 0
- GRIB_jDirectionIncrementInDegrees :
- 0.25
- GRIB_jPointsAreConsecutive :
- 0
- GRIB_jScansPositively :
- 0
- GRIB_latitudeOfFirstGridPointInDegrees :
- 90.0
- GRIB_latitudeOfLastGridPointInDegrees :
- -90.0
- GRIB_longitudeOfFirstGridPointInDegrees :
- 0.0
- GRIB_longitudeOfLastGridPointInDegrees :
- 359.75
- GRIB_missingValue :
- 3.4028234663852886e+38
- GRIB_name :
- Surface net long-wave (thermal) radiation, clear sky
- GRIB_numberOfPoints :
- 1038240
- GRIB_paramId :
- 211
- GRIB_shortName :
- strc
- GRIB_stepType :
- accum
- GRIB_stepUnits :
- 1
- GRIB_totalNumber :
- 0
- GRIB_typeOfLevel :
- surface
- GRIB_units :
- J m**-2
- GRIB_uvRelativeToGrid :
- 0
- long_name :
- Surface net long-wave (thermal) radiation, clear sky
- standard_name :
- surface_net_downward_longwave_flux_assuming_clear_sky
- units :
- J m**-2
Array Chunk Bytes 2.86 TiB 67.50 MiB Shape (756768, 721, 1440) (4320, 64, 64) Dask graph 48576 chunks in 2 graph layers Data type float32 numpy.ndarray - strd(valid_time, latitude, longitude)float32dask.array<chunksize=(4320, 64, 64), meta=np.ndarray>
- GRIB_NV :
- 0
- GRIB_Nx :
- 1440
- GRIB_Ny :
- 721
- GRIB_cfName :
- unknown
- GRIB_cfVarName :
- strd
- GRIB_dataType :
- fc
- GRIB_gridDefinitionDescription :
- Latitude/Longitude Grid
- GRIB_gridType :
- regular_ll
- GRIB_iDirectionIncrementInDegrees :
- 0.25
- GRIB_iScansNegatively :
- 0
- GRIB_jDirectionIncrementInDegrees :
- 0.25
- GRIB_jPointsAreConsecutive :
- 0
- GRIB_jScansPositively :
- 0
- GRIB_latitudeOfFirstGridPointInDegrees :
- 90.0
- GRIB_latitudeOfLastGridPointInDegrees :
- -90.0
- GRIB_longitudeOfFirstGridPointInDegrees :
- 0.0
- GRIB_longitudeOfLastGridPointInDegrees :
- 359.75
- GRIB_missingValue :
- 3.4028234663852886e+38
- GRIB_name :
- Surface long-wave (thermal) radiation downwards
- GRIB_numberOfPoints :
- 1038240
- GRIB_paramId :
- 175
- GRIB_shortName :
- strd
- GRIB_stepType :
- accum
- GRIB_stepUnits :
- 1
- GRIB_totalNumber :
- 0
- GRIB_typeOfLevel :
- surface
- GRIB_units :
- J m**-2
- GRIB_uvRelativeToGrid :
- 0
- long_name :
- Surface long-wave (thermal) radiation downwards
- standard_name :
- unknown
- units :
- J m**-2
Array Chunk Bytes 2.86 TiB 67.50 MiB Shape (756768, 721, 1440) (4320, 64, 64) Dask graph 48576 chunks in 2 graph layers Data type float32 numpy.ndarray - strdc(valid_time, latitude, longitude)float32dask.array<chunksize=(4320, 64, 64), meta=np.ndarray>
- GRIB_NV :
- 0
- GRIB_Nx :
- 1440
- GRIB_Ny :
- 721
- GRIB_cfName :
- unknown
- GRIB_cfVarName :
- strdc
- GRIB_dataType :
- fc
- GRIB_gridDefinitionDescription :
- Latitude/Longitude Grid
- GRIB_gridType :
- regular_ll
- GRIB_iDirectionIncrementInDegrees :
- 0.25
- GRIB_iScansNegatively :
- 0
- GRIB_jDirectionIncrementInDegrees :
- 0.25
- GRIB_jPointsAreConsecutive :
- 0
- GRIB_jScansPositively :
- 0
- GRIB_latitudeOfFirstGridPointInDegrees :
- 90.0
- GRIB_latitudeOfLastGridPointInDegrees :
- -90.0
- GRIB_longitudeOfFirstGridPointInDegrees :
- 0.0
- GRIB_longitudeOfLastGridPointInDegrees :
- 359.75
- GRIB_missingValue :
- 3.4028234663852886e+38
- GRIB_name :
- Surface long-wave (thermal) radiation downward clear-sky
- GRIB_numberOfPoints :
- 1038240
- GRIB_paramId :
- 228130
- GRIB_shortName :
- strdc
- GRIB_stepType :
- accum
- GRIB_stepUnits :
- 1
- GRIB_totalNumber :
- 0
- GRIB_typeOfLevel :
- surface
- GRIB_units :
- J m**-2
- GRIB_uvRelativeToGrid :
- 0
- long_name :
- Surface long-wave (thermal) radiation downward clear-sky
- standard_name :
- unknown
- units :
- J m**-2
Array Chunk Bytes 2.86 TiB 67.50 MiB Shape (756768, 721, 1440) (4320, 64, 64) Dask graph 48576 chunks in 2 graph layers Data type float32 numpy.ndarray - swvl1(valid_time, latitude, longitude)float32dask.array<chunksize=(4320, 64, 64), meta=np.ndarray>
- GRIB_NV :
- 0
- GRIB_Nx :
- 1440
- GRIB_Ny :
- 721
- GRIB_cfName :
- unknown
- GRIB_cfVarName :
- swvl1
- GRIB_dataType :
- an
- GRIB_gridDefinitionDescription :
- Latitude/Longitude Grid
- GRIB_gridType :
- regular_ll
- GRIB_iDirectionIncrementInDegrees :
- 0.25
- GRIB_iScansNegatively :
- 0
- GRIB_jDirectionIncrementInDegrees :
- 0.25
- GRIB_jPointsAreConsecutive :
- 0
- GRIB_jScansPositively :
- 0
- GRIB_latitudeOfFirstGridPointInDegrees :
- 90.0
- GRIB_latitudeOfLastGridPointInDegrees :
- -90.0
- GRIB_longitudeOfFirstGridPointInDegrees :
- 0.0
- GRIB_longitudeOfLastGridPointInDegrees :
- 359.75
- GRIB_missingValue :
- 3.4028234663852886e+38
- GRIB_name :
- Volumetric soil water layer 1
- GRIB_numberOfPoints :
- 1038240
- GRIB_paramId :
- 39
- GRIB_shortName :
- swvl1
- GRIB_stepType :
- instant
- GRIB_stepUnits :
- 1
- GRIB_totalNumber :
- 0
- GRIB_typeOfLevel :
- depthBelowLandLayer
- GRIB_units :
- m**3 m**-3
- GRIB_uvRelativeToGrid :
- 0
- long_name :
- Volumetric soil water layer 1
- standard_name :
- unknown
- units :
- m**3 m**-3
Array Chunk Bytes 2.86 TiB 67.50 MiB Shape (756768, 721, 1440) (4320, 64, 64) Dask graph 48576 chunks in 2 graph layers Data type float32 numpy.ndarray - swvl2(valid_time, latitude, longitude)float32dask.array<chunksize=(4320, 64, 64), meta=np.ndarray>
- GRIB_NV :
- 0
- GRIB_Nx :
- 1440
- GRIB_Ny :
- 721
- GRIB_cfName :
- unknown
- GRIB_cfVarName :
- swvl2
- GRIB_dataType :
- an
- GRIB_gridDefinitionDescription :
- Latitude/Longitude Grid
- GRIB_gridType :
- regular_ll
- GRIB_iDirectionIncrementInDegrees :
- 0.25
- GRIB_iScansNegatively :
- 0
- GRIB_jDirectionIncrementInDegrees :
- 0.25
- GRIB_jPointsAreConsecutive :
- 0
- GRIB_jScansPositively :
- 0
- GRIB_latitudeOfFirstGridPointInDegrees :
- 90.0
- GRIB_latitudeOfLastGridPointInDegrees :
- -90.0
- GRIB_longitudeOfFirstGridPointInDegrees :
- 0.0
- GRIB_longitudeOfLastGridPointInDegrees :
- 359.75
- GRIB_missingValue :
- 3.4028234663852886e+38
- GRIB_name :
- Volumetric soil water layer 2
- GRIB_numberOfPoints :
- 1038240
- GRIB_paramId :
- 40
- GRIB_shortName :
- swvl2
- GRIB_stepType :
- instant
- GRIB_stepUnits :
- 1
- GRIB_totalNumber :
- 0
- GRIB_typeOfLevel :
- depthBelowLandLayer
- GRIB_units :
- m**3 m**-3
- GRIB_uvRelativeToGrid :
- 0
- long_name :
- Volumetric soil water layer 2
- standard_name :
- unknown
- units :
- m**3 m**-3
Array Chunk Bytes 2.86 TiB 67.50 MiB Shape (756768, 721, 1440) (4320, 64, 64) Dask graph 48576 chunks in 2 graph layers Data type float32 numpy.ndarray - swvl3(valid_time, latitude, longitude)float32dask.array<chunksize=(4320, 64, 64), meta=np.ndarray>
- GRIB_NV :
- 0
- GRIB_Nx :
- 1440
- GRIB_Ny :
- 721
- GRIB_cfName :
- unknown
- GRIB_cfVarName :
- swvl3
- GRIB_dataType :
- an
- GRIB_gridDefinitionDescription :
- Latitude/Longitude Grid
- GRIB_gridType :
- regular_ll
- GRIB_iDirectionIncrementInDegrees :
- 0.25
- GRIB_iScansNegatively :
- 0
- GRIB_jDirectionIncrementInDegrees :
- 0.25
- GRIB_jPointsAreConsecutive :
- 0
- GRIB_jScansPositively :
- 0
- GRIB_latitudeOfFirstGridPointInDegrees :
- 90.0
- GRIB_latitudeOfLastGridPointInDegrees :
- -90.0
- GRIB_longitudeOfFirstGridPointInDegrees :
- 0.0
- GRIB_longitudeOfLastGridPointInDegrees :
- 359.75
- GRIB_missingValue :
- 3.4028234663852886e+38
- GRIB_name :
- Volumetric soil water layer 3
- GRIB_numberOfPoints :
- 1038240
- GRIB_paramId :
- 41
- GRIB_shortName :
- swvl3
- GRIB_stepType :
- instant
- GRIB_stepUnits :
- 1
- GRIB_totalNumber :
- 0
- GRIB_typeOfLevel :
- depthBelowLandLayer
- GRIB_units :
- m**3 m**-3
- GRIB_uvRelativeToGrid :
- 0
- long_name :
- Volumetric soil water layer 3
- standard_name :
- unknown
- units :
- m**3 m**-3
Array Chunk Bytes 2.86 TiB 67.50 MiB Shape (756768, 721, 1440) (4320, 64, 64) Dask graph 48576 chunks in 2 graph layers Data type float32 numpy.ndarray - swvl4(valid_time, latitude, longitude)float32dask.array<chunksize=(4320, 64, 64), meta=np.ndarray>
- GRIB_NV :
- 0
- GRIB_Nx :
- 1440
- GRIB_Ny :
- 721
- GRIB_cfName :
- unknown
- GRIB_cfVarName :
- swvl4
- GRIB_dataType :
- an
- GRIB_gridDefinitionDescription :
- Latitude/Longitude Grid
- GRIB_gridType :
- regular_ll
- GRIB_iDirectionIncrementInDegrees :
- 0.25
- GRIB_iScansNegatively :
- 0
- GRIB_jDirectionIncrementInDegrees :
- 0.25
- GRIB_jPointsAreConsecutive :
- 0
- GRIB_jScansPositively :
- 0
- GRIB_latitudeOfFirstGridPointInDegrees :
- 90.0
- GRIB_latitudeOfLastGridPointInDegrees :
- -90.0
- GRIB_longitudeOfFirstGridPointInDegrees :
- 0.0
- GRIB_longitudeOfLastGridPointInDegrees :
- 359.75
- GRIB_missingValue :
- 3.4028234663852886e+38
- GRIB_name :
- Volumetric soil water layer 4
- GRIB_numberOfPoints :
- 1038240
- GRIB_paramId :
- 42
- GRIB_shortName :
- swvl4
- GRIB_stepType :
- instant
- GRIB_stepUnits :
- 1
- GRIB_totalNumber :
- 0
- GRIB_typeOfLevel :
- depthBelowLandLayer
- GRIB_units :
- m**3 m**-3
- GRIB_uvRelativeToGrid :
- 0
- long_name :
- Volumetric soil water layer 4
- standard_name :
- unknown
- units :
- m**3 m**-3
Array Chunk Bytes 2.86 TiB 67.50 MiB Shape (756768, 721, 1440) (4320, 64, 64) Dask graph 48576 chunks in 2 graph layers Data type float32 numpy.ndarray - t2m(valid_time, latitude, longitude)float32dask.array<chunksize=(4320, 64, 64), meta=np.ndarray>
- GRIB_NV :
- 0
- GRIB_Nx :
- 1440
- GRIB_Ny :
- 721
- GRIB_cfName :
- unknown
- GRIB_cfVarName :
- t2m
- GRIB_dataType :
- an
- GRIB_gridDefinitionDescription :
- Latitude/Longitude Grid
- GRIB_gridType :
- regular_ll
- GRIB_iDirectionIncrementInDegrees :
- 0.25
- GRIB_iScansNegatively :
- 0
- GRIB_jDirectionIncrementInDegrees :
- 0.25
- GRIB_jPointsAreConsecutive :
- 0
- GRIB_jScansPositively :
- 0
- GRIB_latitudeOfFirstGridPointInDegrees :
- 90.0
- GRIB_latitudeOfLastGridPointInDegrees :
- -90.0
- GRIB_longitudeOfFirstGridPointInDegrees :
- 0.0
- GRIB_longitudeOfLastGridPointInDegrees :
- 359.75
- GRIB_missingValue :
- 3.4028234663852886e+38
- GRIB_name :
- 2 metre temperature
- GRIB_numberOfPoints :
- 1038240
- GRIB_paramId :
- 167
- GRIB_shortName :
- 2t
- GRIB_stepType :
- instant
- GRIB_stepUnits :
- 1
- GRIB_totalNumber :
- 0
- GRIB_typeOfLevel :
- surface
- GRIB_units :
- K
- GRIB_uvRelativeToGrid :
- 0
- long_name :
- 2 metre temperature
- standard_name :
- unknown
- units :
- K
Array Chunk Bytes 2.86 TiB 67.50 MiB Shape (756768, 721, 1440) (4320, 64, 64) Dask graph 48576 chunks in 2 graph layers Data type float32 numpy.ndarray - tcc(valid_time, latitude, longitude)float32dask.array<chunksize=(4320, 64, 64), meta=np.ndarray>
- GRIB_NV :
- 0
- GRIB_Nx :
- 1440
- GRIB_Ny :
- 721
- GRIB_cfName :
- cloud_area_fraction
- GRIB_cfVarName :
- tcc
- GRIB_dataType :
- an
- GRIB_gridDefinitionDescription :
- Latitude/Longitude Grid
- GRIB_gridType :
- regular_ll
- GRIB_iDirectionIncrementInDegrees :
- 0.25
- GRIB_iScansNegatively :
- 0
- GRIB_jDirectionIncrementInDegrees :
- 0.25
- GRIB_jPointsAreConsecutive :
- 0
- GRIB_jScansPositively :
- 0
- GRIB_latitudeOfFirstGridPointInDegrees :
- 90.0
- GRIB_latitudeOfLastGridPointInDegrees :
- -90.0
- GRIB_longitudeOfFirstGridPointInDegrees :
- 0.0
- GRIB_longitudeOfLastGridPointInDegrees :
- 359.75
- GRIB_missingValue :
- 3.4028234663852886e+38
- GRIB_name :
- Total cloud cover
- GRIB_numberOfPoints :
- 1038240
- GRIB_paramId :
- 164
- GRIB_shortName :
- tcc
- GRIB_stepType :
- instant
- GRIB_stepUnits :
- 1
- GRIB_totalNumber :
- 0
- GRIB_typeOfLevel :
- surface
- GRIB_units :
- (0 - 1)
- GRIB_uvRelativeToGrid :
- 0
- long_name :
- Total cloud cover
- standard_name :
- cloud_area_fraction
- units :
- (0 - 1)
Array Chunk Bytes 2.86 TiB 67.50 MiB Shape (756768, 721, 1440) (4320, 64, 64) Dask graph 48576 chunks in 2 graph layers Data type float32 numpy.ndarray - tciw(valid_time, latitude, longitude)float32dask.array<chunksize=(4320, 64, 64), meta=np.ndarray>
- GRIB_NV :
- 0
- GRIB_Nx :
- 1440
- GRIB_Ny :
- 721
- GRIB_cfName :
- unknown
- GRIB_cfVarName :
- tciw
- GRIB_dataType :
- an
- GRIB_gridDefinitionDescription :
- Latitude/Longitude Grid
- GRIB_gridType :
- regular_ll
- GRIB_iDirectionIncrementInDegrees :
- 0.25
- GRIB_iScansNegatively :
- 0
- GRIB_jDirectionIncrementInDegrees :
- 0.25
- GRIB_jPointsAreConsecutive :
- 0
- GRIB_jScansPositively :
- 0
- GRIB_latitudeOfFirstGridPointInDegrees :
- 90.0
- GRIB_latitudeOfLastGridPointInDegrees :
- -90.0
- GRIB_longitudeOfFirstGridPointInDegrees :
- 0.0
- GRIB_longitudeOfLastGridPointInDegrees :
- 359.75
- GRIB_missingValue :
- 3.4028234663852886e+38
- GRIB_name :
- Total column cloud ice water
- GRIB_numberOfPoints :
- 1038240
- GRIB_paramId :
- 79
- GRIB_shortName :
- tciw
- GRIB_stepType :
- instant
- GRIB_stepUnits :
- 1
- GRIB_totalNumber :
- 0
- GRIB_typeOfLevel :
- surface
- GRIB_units :
- kg m**-2
- GRIB_uvRelativeToGrid :
- 0
- long_name :
- Total column cloud ice water
- standard_name :
- unknown
- units :
- kg m**-2
Array Chunk Bytes 2.86 TiB 67.50 MiB Shape (756768, 721, 1440) (4320, 64, 64) Dask graph 48576 chunks in 2 graph layers Data type float32 numpy.ndarray - tclw(valid_time, latitude, longitude)float32dask.array<chunksize=(4320, 64, 64), meta=np.ndarray>
- GRIB_NV :
- 0
- GRIB_Nx :
- 1440
- GRIB_Ny :
- 721
- GRIB_cfName :
- unknown
- GRIB_cfVarName :
- tclw
- GRIB_dataType :
- an
- GRIB_gridDefinitionDescription :
- Latitude/Longitude Grid
- GRIB_gridType :
- regular_ll
- GRIB_iDirectionIncrementInDegrees :
- 0.25
- GRIB_iScansNegatively :
- 0
- GRIB_jDirectionIncrementInDegrees :
- 0.25
- GRIB_jPointsAreConsecutive :
- 0
- GRIB_jScansPositively :
- 0
- GRIB_latitudeOfFirstGridPointInDegrees :
- 90.0
- GRIB_latitudeOfLastGridPointInDegrees :
- -90.0
- GRIB_longitudeOfFirstGridPointInDegrees :
- 0.0
- GRIB_longitudeOfLastGridPointInDegrees :
- 359.75
- GRIB_missingValue :
- 3.4028234663852886e+38
- GRIB_name :
- Total column cloud liquid water
- GRIB_numberOfPoints :
- 1038240
- GRIB_paramId :
- 78
- GRIB_shortName :
- tclw
- GRIB_stepType :
- instant
- GRIB_stepUnits :
- 1
- GRIB_totalNumber :
- 0
- GRIB_typeOfLevel :
- surface
- GRIB_units :
- kg m**-2
- GRIB_uvRelativeToGrid :
- 0
- long_name :
- Total column cloud liquid water
- standard_name :
- unknown
- units :
- kg m**-2
Array Chunk Bytes 2.86 TiB 67.50 MiB Shape (756768, 721, 1440) (4320, 64, 64) Dask graph 48576 chunks in 2 graph layers Data type float32 numpy.ndarray - tcrw(valid_time, latitude, longitude)float32dask.array<chunksize=(4320, 64, 64), meta=np.ndarray>
- GRIB_NV :
- 0
- GRIB_Nx :
- 1440
- GRIB_Ny :
- 721
- GRIB_cfName :
- unknown
- GRIB_cfVarName :
- tcrw
- GRIB_dataType :
- an
- GRIB_gridDefinitionDescription :
- Latitude/Longitude Grid
- GRIB_gridType :
- regular_ll
- GRIB_iDirectionIncrementInDegrees :
- 0.25
- GRIB_iScansNegatively :
- 0
- GRIB_jDirectionIncrementInDegrees :
- 0.25
- GRIB_jPointsAreConsecutive :
- 0
- GRIB_jScansPositively :
- 0
- GRIB_latitudeOfFirstGridPointInDegrees :
- 90.0
- GRIB_latitudeOfLastGridPointInDegrees :
- -90.0
- GRIB_longitudeOfFirstGridPointInDegrees :
- 0.0
- GRIB_longitudeOfLastGridPointInDegrees :
- 359.75
- GRIB_missingValue :
- 3.4028234663852886e+38
- GRIB_name :
- Total column rain water
- GRIB_numberOfPoints :
- 1038240
- GRIB_paramId :
- 228089
- GRIB_shortName :
- tcrw
- GRIB_stepType :
- instant
- GRIB_stepUnits :
- 1
- GRIB_totalNumber :
- 0
- GRIB_typeOfLevel :
- surface
- GRIB_units :
- kg m**-2
- GRIB_uvRelativeToGrid :
- 0
- long_name :
- Total column rain water
- standard_name :
- unknown
- units :
- kg m**-2
Array Chunk Bytes 2.86 TiB 67.50 MiB Shape (756768, 721, 1440) (4320, 64, 64) Dask graph 48576 chunks in 2 graph layers Data type float32 numpy.ndarray - tcsw(valid_time, latitude, longitude)float32dask.array<chunksize=(4320, 64, 64), meta=np.ndarray>
- GRIB_NV :
- 0
- GRIB_Nx :
- 1440
- GRIB_Ny :
- 721
- GRIB_cfName :
- unknown
- GRIB_cfVarName :
- tcsw
- GRIB_dataType :
- an
- GRIB_gridDefinitionDescription :
- Latitude/Longitude Grid
- GRIB_gridType :
- regular_ll
- GRIB_iDirectionIncrementInDegrees :
- 0.25
- GRIB_iScansNegatively :
- 0
- GRIB_jDirectionIncrementInDegrees :
- 0.25
- GRIB_jPointsAreConsecutive :
- 0
- GRIB_jScansPositively :
- 0
- GRIB_latitudeOfFirstGridPointInDegrees :
- 90.0
- GRIB_latitudeOfLastGridPointInDegrees :
- -90.0
- GRIB_longitudeOfFirstGridPointInDegrees :
- 0.0
- GRIB_longitudeOfLastGridPointInDegrees :
- 359.75
- GRIB_missingValue :
- 3.4028234663852886e+38
- GRIB_name :
- Total column snow water
- GRIB_numberOfPoints :
- 1038240
- GRIB_paramId :
- 228090
- GRIB_shortName :
- tcsw
- GRIB_stepType :
- instant
- GRIB_stepUnits :
- 1
- GRIB_totalNumber :
- 0
- GRIB_typeOfLevel :
- surface
- GRIB_units :
- kg m**-2
- GRIB_uvRelativeToGrid :
- 0
- long_name :
- Total column snow water
- standard_name :
- unknown
- units :
- kg m**-2
Array Chunk Bytes 2.86 TiB 67.50 MiB Shape (756768, 721, 1440) (4320, 64, 64) Dask graph 48576 chunks in 2 graph layers Data type float32 numpy.ndarray - tcwv(valid_time, latitude, longitude)float32dask.array<chunksize=(4320, 64, 64), meta=np.ndarray>
- GRIB_NV :
- 0
- GRIB_Nx :
- 1440
- GRIB_Ny :
- 721
- GRIB_cfName :
- lwe_thickness_of_atmosphere_mass_content_of_water_vapor
- GRIB_cfVarName :
- tcwv
- GRIB_dataType :
- an
- GRIB_gridDefinitionDescription :
- Latitude/Longitude Grid
- GRIB_gridType :
- regular_ll
- GRIB_iDirectionIncrementInDegrees :
- 0.25
- GRIB_iScansNegatively :
- 0
- GRIB_jDirectionIncrementInDegrees :
- 0.25
- GRIB_jPointsAreConsecutive :
- 0
- GRIB_jScansPositively :
- 0
- GRIB_latitudeOfFirstGridPointInDegrees :
- 90.0
- GRIB_latitudeOfLastGridPointInDegrees :
- -90.0
- GRIB_longitudeOfFirstGridPointInDegrees :
- 0.0
- GRIB_longitudeOfLastGridPointInDegrees :
- 359.75
- GRIB_missingValue :
- 3.4028234663852886e+38
- GRIB_name :
- Total column vertically-integrated water vapour
- GRIB_numberOfPoints :
- 1038240
- GRIB_paramId :
- 137
- GRIB_shortName :
- tcwv
- GRIB_stepType :
- instant
- GRIB_stepUnits :
- 1
- GRIB_totalNumber :
- 0
- GRIB_typeOfLevel :
- surface
- GRIB_units :
- kg m**-2
- GRIB_uvRelativeToGrid :
- 0
- long_name :
- Total column vertically-integrated water vapour
- standard_name :
- lwe_thickness_of_atmosphere_mass_content_of_water_vapor
- units :
- kg m**-2
Array Chunk Bytes 2.86 TiB 67.50 MiB Shape (756768, 721, 1440) (4320, 64, 64) Dask graph 48576 chunks in 2 graph layers Data type float32 numpy.ndarray - tisr(valid_time, latitude, longitude)float32dask.array<chunksize=(4320, 64, 64), meta=np.ndarray>
- GRIB_NV :
- 0
- GRIB_Nx :
- 1440
- GRIB_Ny :
- 721
- GRIB_cfName :
- unknown
- GRIB_cfVarName :
- tisr
- GRIB_dataType :
- fc
- GRIB_gridDefinitionDescription :
- Latitude/Longitude Grid
- GRIB_gridType :
- regular_ll
- GRIB_iDirectionIncrementInDegrees :
- 0.25
- GRIB_iScansNegatively :
- 0
- GRIB_jDirectionIncrementInDegrees :
- 0.25
- GRIB_jPointsAreConsecutive :
- 0
- GRIB_jScansPositively :
- 0
- GRIB_latitudeOfFirstGridPointInDegrees :
- 90.0
- GRIB_latitudeOfLastGridPointInDegrees :
- -90.0
- GRIB_longitudeOfFirstGridPointInDegrees :
- 0.0
- GRIB_longitudeOfLastGridPointInDegrees :
- 359.75
- GRIB_missingValue :
- 3.4028234663852886e+38
- GRIB_name :
- TOA incident short-wave (solar) radiation
- GRIB_numberOfPoints :
- 1038240
- GRIB_paramId :
- 212
- GRIB_shortName :
- tisr
- GRIB_stepType :
- accum
- GRIB_stepUnits :
- 1
- GRIB_totalNumber :
- 0
- GRIB_typeOfLevel :
- surface
- GRIB_units :
- J m**-2
- GRIB_uvRelativeToGrid :
- 0
- long_name :
- TOA incident short-wave (solar) radiation
- standard_name :
- unknown
- units :
- J m**-2
Array Chunk Bytes 2.86 TiB 67.50 MiB Shape (756768, 721, 1440) (4320, 64, 64) Dask graph 48576 chunks in 2 graph layers Data type float32 numpy.ndarray - tp(valid_time, latitude, longitude)float32dask.array<chunksize=(4320, 64, 64), meta=np.ndarray>
- GRIB_NV :
- 0
- GRIB_Nx :
- 1440
- GRIB_Ny :
- 721
- GRIB_cfName :
- unknown
- GRIB_cfVarName :
- tp
- GRIB_dataType :
- fc
- GRIB_gridDefinitionDescription :
- Latitude/Longitude Grid
- GRIB_gridType :
- regular_ll
- GRIB_iDirectionIncrementInDegrees :
- 0.25
- GRIB_iScansNegatively :
- 0
- GRIB_jDirectionIncrementInDegrees :
- 0.25
- GRIB_jPointsAreConsecutive :
- 0
- GRIB_jScansPositively :
- 0
- GRIB_latitudeOfFirstGridPointInDegrees :
- 90.0
- GRIB_latitudeOfLastGridPointInDegrees :
- -90.0
- GRIB_longitudeOfFirstGridPointInDegrees :
- 0.0
- GRIB_longitudeOfLastGridPointInDegrees :
- 359.75
- GRIB_missingValue :
- 3.4028234663852886e+38
- GRIB_name :
- Total precipitation
- GRIB_numberOfPoints :
- 1038240
- GRIB_paramId :
- 228
- GRIB_shortName :
- tp
- GRIB_stepType :
- accum
- GRIB_stepUnits :
- 1
- GRIB_totalNumber :
- 0
- GRIB_typeOfLevel :
- surface
- GRIB_units :
- m
- GRIB_uvRelativeToGrid :
- 0
- long_name :
- Total precipitation
- standard_name :
- unknown
- units :
- m
Array Chunk Bytes 2.86 TiB 67.50 MiB Shape (756768, 721, 1440) (4320, 64, 64) Dask graph 48576 chunks in 2 graph layers Data type float32 numpy.ndarray - tsn(valid_time, latitude, longitude)float32dask.array<chunksize=(4320, 64, 64), meta=np.ndarray>
- GRIB_NV :
- 0
- GRIB_Nx :
- 1440
- GRIB_Ny :
- 721
- GRIB_cfName :
- temperature_in_surface_snow
- GRIB_cfVarName :
- tsn
- GRIB_dataType :
- an
- GRIB_gridDefinitionDescription :
- Latitude/Longitude Grid
- GRIB_gridType :
- regular_ll
- GRIB_iDirectionIncrementInDegrees :
- 0.25
- GRIB_iScansNegatively :
- 0
- GRIB_jDirectionIncrementInDegrees :
- 0.25
- GRIB_jPointsAreConsecutive :
- 0
- GRIB_jScansPositively :
- 0
- GRIB_latitudeOfFirstGridPointInDegrees :
- 90.0
- GRIB_latitudeOfLastGridPointInDegrees :
- -90.0
- GRIB_longitudeOfFirstGridPointInDegrees :
- 0.0
- GRIB_longitudeOfLastGridPointInDegrees :
- 359.75
- GRIB_missingValue :
- 3.4028234663852886e+38
- GRIB_name :
- Temperature of snow layer
- GRIB_numberOfPoints :
- 1038240
- GRIB_paramId :
- 238
- GRIB_shortName :
- tsn
- GRIB_stepType :
- instant
- GRIB_stepUnits :
- 1
- GRIB_totalNumber :
- 0
- GRIB_typeOfLevel :
- surface
- GRIB_units :
- K
- GRIB_uvRelativeToGrid :
- 0
- long_name :
- Temperature of snow layer
- standard_name :
- temperature_in_surface_snow
- units :
- K
Array Chunk Bytes 2.86 TiB 67.50 MiB Shape (756768, 721, 1440) (4320, 64, 64) Dask graph 48576 chunks in 2 graph layers Data type float32 numpy.ndarray - tsr(valid_time, latitude, longitude)float32dask.array<chunksize=(4320, 64, 64), meta=np.ndarray>
- GRIB_NV :
- 0
- GRIB_Nx :
- 1440
- GRIB_Ny :
- 721
- GRIB_cfName :
- toa_net_upward_shortwave_flux
- GRIB_cfVarName :
- tsr
- GRIB_dataType :
- fc
- GRIB_gridDefinitionDescription :
- Latitude/Longitude Grid
- GRIB_gridType :
- regular_ll
- GRIB_iDirectionIncrementInDegrees :
- 0.25
- GRIB_iScansNegatively :
- 0
- GRIB_jDirectionIncrementInDegrees :
- 0.25
- GRIB_jPointsAreConsecutive :
- 0
- GRIB_jScansPositively :
- 0
- GRIB_latitudeOfFirstGridPointInDegrees :
- 90.0
- GRIB_latitudeOfLastGridPointInDegrees :
- -90.0
- GRIB_longitudeOfFirstGridPointInDegrees :
- 0.0
- GRIB_longitudeOfLastGridPointInDegrees :
- 359.75
- GRIB_missingValue :
- 3.4028234663852886e+38
- GRIB_name :
- Top net short-wave (solar) radiation
- GRIB_numberOfPoints :
- 1038240
- GRIB_paramId :
- 178
- GRIB_shortName :
- tsr
- GRIB_stepType :
- accum
- GRIB_stepUnits :
- 1
- GRIB_totalNumber :
- 0
- GRIB_typeOfLevel :
- surface
- GRIB_units :
- J m**-2
- GRIB_uvRelativeToGrid :
- 0
- long_name :
- Top net short-wave (solar) radiation
- standard_name :
- toa_net_upward_shortwave_flux
- units :
- J m**-2
Array Chunk Bytes 2.86 TiB 67.50 MiB Shape (756768, 721, 1440) (4320, 64, 64) Dask graph 48576 chunks in 2 graph layers Data type float32 numpy.ndarray - tsrc(valid_time, latitude, longitude)float32dask.array<chunksize=(4320, 64, 64), meta=np.ndarray>
- GRIB_NV :
- 0
- GRIB_Nx :
- 1440
- GRIB_Ny :
- 721
- GRIB_cfName :
- unknown
- GRIB_cfVarName :
- tsrc
- GRIB_dataType :
- fc
- GRIB_gridDefinitionDescription :
- Latitude/Longitude Grid
- GRIB_gridType :
- regular_ll
- GRIB_iDirectionIncrementInDegrees :
- 0.25
- GRIB_iScansNegatively :
- 0
- GRIB_jDirectionIncrementInDegrees :
- 0.25
- GRIB_jPointsAreConsecutive :
- 0
- GRIB_jScansPositively :
- 0
- GRIB_latitudeOfFirstGridPointInDegrees :
- 90.0
- GRIB_latitudeOfLastGridPointInDegrees :
- -90.0
- GRIB_longitudeOfFirstGridPointInDegrees :
- 0.0
- GRIB_longitudeOfLastGridPointInDegrees :
- 359.75
- GRIB_missingValue :
- 3.4028234663852886e+38
- GRIB_name :
- Top net short-wave (solar) radiation, clear sky
- GRIB_numberOfPoints :
- 1038240
- GRIB_paramId :
- 208
- GRIB_shortName :
- tsrc
- GRIB_stepType :
- accum
- GRIB_stepUnits :
- 1
- GRIB_totalNumber :
- 0
- GRIB_typeOfLevel :
- surface
- GRIB_units :
- J m**-2
- GRIB_uvRelativeToGrid :
- 0
- long_name :
- Top net short-wave (solar) radiation, clear sky
- standard_name :
- unknown
- units :
- J m**-2
Array Chunk Bytes 2.86 TiB 67.50 MiB Shape (756768, 721, 1440) (4320, 64, 64) Dask graph 48576 chunks in 2 graph layers Data type float32 numpy.ndarray - ttr(valid_time, latitude, longitude)float32dask.array<chunksize=(4320, 64, 64), meta=np.ndarray>
- GRIB_NV :
- 0
- GRIB_Nx :
- 1440
- GRIB_Ny :
- 721
- GRIB_cfName :
- toa_outgoing_longwave_flux
- GRIB_cfVarName :
- ttr
- GRIB_dataType :
- fc
- GRIB_gridDefinitionDescription :
- Latitude/Longitude Grid
- GRIB_gridType :
- regular_ll
- GRIB_iDirectionIncrementInDegrees :
- 0.25
- GRIB_iScansNegatively :
- 0
- GRIB_jDirectionIncrementInDegrees :
- 0.25
- GRIB_jPointsAreConsecutive :
- 0
- GRIB_jScansPositively :
- 0
- GRIB_latitudeOfFirstGridPointInDegrees :
- 90.0
- GRIB_latitudeOfLastGridPointInDegrees :
- -90.0
- GRIB_longitudeOfFirstGridPointInDegrees :
- 0.0
- GRIB_longitudeOfLastGridPointInDegrees :
- 359.75
- GRIB_missingValue :
- 3.4028234663852886e+38
- GRIB_name :
- Top net long-wave (thermal) radiation
- GRIB_numberOfPoints :
- 1038240
- GRIB_paramId :
- 179
- GRIB_shortName :
- ttr
- GRIB_stepType :
- accum
- GRIB_stepUnits :
- 1
- GRIB_totalNumber :
- 0
- GRIB_typeOfLevel :
- surface
- GRIB_units :
- J m**-2
- GRIB_uvRelativeToGrid :
- 0
- long_name :
- Top net long-wave (thermal) radiation
- standard_name :
- toa_outgoing_longwave_flux
- units :
- J m**-2
Array Chunk Bytes 2.86 TiB 67.50 MiB Shape (756768, 721, 1440) (4320, 64, 64) Dask graph 48576 chunks in 2 graph layers Data type float32 numpy.ndarray - ttrc(valid_time, latitude, longitude)float32dask.array<chunksize=(4320, 64, 64), meta=np.ndarray>
- GRIB_NV :
- 0
- GRIB_Nx :
- 1440
- GRIB_Ny :
- 721
- GRIB_cfName :
- unknown
- GRIB_cfVarName :
- ttrc
- GRIB_dataType :
- fc
- GRIB_gridDefinitionDescription :
- Latitude/Longitude Grid
- GRIB_gridType :
- regular_ll
- GRIB_iDirectionIncrementInDegrees :
- 0.25
- GRIB_iScansNegatively :
- 0
- GRIB_jDirectionIncrementInDegrees :
- 0.25
- GRIB_jPointsAreConsecutive :
- 0
- GRIB_jScansPositively :
- 0
- GRIB_latitudeOfFirstGridPointInDegrees :
- 90.0
- GRIB_latitudeOfLastGridPointInDegrees :
- -90.0
- GRIB_longitudeOfFirstGridPointInDegrees :
- 0.0
- GRIB_longitudeOfLastGridPointInDegrees :
- 359.75
- GRIB_missingValue :
- 3.4028234663852886e+38
- GRIB_name :
- Top net long-wave (thermal) radiation, clear sky
- GRIB_numberOfPoints :
- 1038240
- GRIB_paramId :
- 209
- GRIB_shortName :
- ttrc
- GRIB_stepType :
- accum
- GRIB_stepUnits :
- 1
- GRIB_totalNumber :
- 0
- GRIB_typeOfLevel :
- surface
- GRIB_units :
- J m**-2
- GRIB_uvRelativeToGrid :
- 0
- long_name :
- Top net long-wave (thermal) radiation, clear sky
- standard_name :
- unknown
- units :
- J m**-2
Array Chunk Bytes 2.86 TiB 67.50 MiB Shape (756768, 721, 1440) (4320, 64, 64) Dask graph 48576 chunks in 2 graph layers Data type float32 numpy.ndarray - tvh(valid_time, latitude, longitude)float32dask.array<chunksize=(4320, 64, 64), meta=np.ndarray>
- GRIB_NV :
- 0
- GRIB_Nx :
- 1440
- GRIB_Ny :
- 721
- GRIB_cfName :
- unknown
- GRIB_cfVarName :
- tvh
- GRIB_dataType :
- an
- GRIB_gridDefinitionDescription :
- Latitude/Longitude Grid
- GRIB_gridType :
- regular_ll
- GRIB_iDirectionIncrementInDegrees :
- 0.25
- GRIB_iScansNegatively :
- 0
- GRIB_jDirectionIncrementInDegrees :
- 0.25
- GRIB_jPointsAreConsecutive :
- 0
- GRIB_jScansPositively :
- 0
- GRIB_latitudeOfFirstGridPointInDegrees :
- 90.0
- GRIB_latitudeOfLastGridPointInDegrees :
- -90.0
- GRIB_longitudeOfFirstGridPointInDegrees :
- 0.0
- GRIB_longitudeOfLastGridPointInDegrees :
- 359.75
- GRIB_missingValue :
- 3.4028234663852886e+38
- GRIB_name :
- Type of high vegetation
- GRIB_numberOfPoints :
- 1038240
- GRIB_paramId :
- 30
- GRIB_shortName :
- tvh
- GRIB_stepType :
- instant
- GRIB_stepUnits :
- 1
- GRIB_totalNumber :
- 0
- GRIB_typeOfLevel :
- surface
- GRIB_units :
- (Code table 4.234)
- GRIB_uvRelativeToGrid :
- 0
- long_name :
- Type of high vegetation
- standard_name :
- unknown
- units :
- (Code table 4.234)
Array Chunk Bytes 2.86 TiB 67.50 MiB Shape (756768, 721, 1440) (4320, 64, 64) Dask graph 48576 chunks in 2 graph layers Data type float32 numpy.ndarray - tvl(valid_time, latitude, longitude)float32dask.array<chunksize=(4320, 64, 64), meta=np.ndarray>
- GRIB_NV :
- 0
- GRIB_Nx :
- 1440
- GRIB_Ny :
- 721
- GRIB_cfName :
- unknown
- GRIB_cfVarName :
- tvl
- GRIB_dataType :
- an
- GRIB_gridDefinitionDescription :
- Latitude/Longitude Grid
- GRIB_gridType :
- regular_ll
- GRIB_iDirectionIncrementInDegrees :
- 0.25
- GRIB_iScansNegatively :
- 0
- GRIB_jDirectionIncrementInDegrees :
- 0.25
- GRIB_jPointsAreConsecutive :
- 0
- GRIB_jScansPositively :
- 0
- GRIB_latitudeOfFirstGridPointInDegrees :
- 90.0
- GRIB_latitudeOfLastGridPointInDegrees :
- -90.0
- GRIB_longitudeOfFirstGridPointInDegrees :
- 0.0
- GRIB_longitudeOfLastGridPointInDegrees :
- 359.75
- GRIB_missingValue :
- 3.4028234663852886e+38
- GRIB_name :
- Type of low vegetation
- GRIB_numberOfPoints :
- 1038240
- GRIB_paramId :
- 29
- GRIB_shortName :
- tvl
- GRIB_stepType :
- instant
- GRIB_stepUnits :
- 1
- GRIB_totalNumber :
- 0
- GRIB_typeOfLevel :
- surface
- GRIB_units :
- (Code table 4.234)
- GRIB_uvRelativeToGrid :
- 0
- long_name :
- Type of low vegetation
- standard_name :
- unknown
- units :
- (Code table 4.234)
Array Chunk Bytes 2.86 TiB 67.50 MiB Shape (756768, 721, 1440) (4320, 64, 64) Dask graph 48576 chunks in 2 graph layers Data type float32 numpy.ndarray - u10(valid_time, latitude, longitude)float32dask.array<chunksize=(4320, 64, 64), meta=np.ndarray>
- GRIB_NV :
- 0
- GRIB_Nx :
- 1440
- GRIB_Ny :
- 721
- GRIB_cfName :
- unknown
- GRIB_cfVarName :
- u10
- GRIB_dataType :
- an
- GRIB_gridDefinitionDescription :
- Latitude/Longitude Grid
- GRIB_gridType :
- regular_ll
- GRIB_iDirectionIncrementInDegrees :
- 0.25
- GRIB_iScansNegatively :
- 0
- GRIB_jDirectionIncrementInDegrees :
- 0.25
- GRIB_jPointsAreConsecutive :
- 0
- GRIB_jScansPositively :
- 0
- GRIB_latitudeOfFirstGridPointInDegrees :
- 90.0
- GRIB_latitudeOfLastGridPointInDegrees :
- -90.0
- GRIB_longitudeOfFirstGridPointInDegrees :
- 0.0
- GRIB_longitudeOfLastGridPointInDegrees :
- 359.75
- GRIB_missingValue :
- 3.4028234663852886e+38
- GRIB_name :
- 10 metre U wind component
- GRIB_numberOfPoints :
- 1038240
- GRIB_paramId :
- 165
- GRIB_shortName :
- 10u
- GRIB_stepType :
- instant
- GRIB_stepUnits :
- 1
- GRIB_totalNumber :
- 0
- GRIB_typeOfLevel :
- surface
- GRIB_units :
- m s**-1
- GRIB_uvRelativeToGrid :
- 0
- long_name :
- 10 metre U wind component
- standard_name :
- unknown
- units :
- m s**-1
Array Chunk Bytes 2.86 TiB 67.50 MiB Shape (756768, 721, 1440) (4320, 64, 64) Dask graph 48576 chunks in 2 graph layers Data type float32 numpy.ndarray - u100(valid_time, latitude, longitude)float32dask.array<chunksize=(4320, 64, 64), meta=np.ndarray>
- GRIB_NV :
- 0
- GRIB_Nx :
- 1440
- GRIB_Ny :
- 721
- GRIB_cfName :
- unknown
- GRIB_cfVarName :
- u100
- GRIB_dataType :
- an
- GRIB_gridDefinitionDescription :
- Latitude/Longitude Grid
- GRIB_gridType :
- regular_ll
- GRIB_iDirectionIncrementInDegrees :
- 0.25
- GRIB_iScansNegatively :
- 0
- GRIB_jDirectionIncrementInDegrees :
- 0.25
- GRIB_jPointsAreConsecutive :
- 0
- GRIB_jScansPositively :
- 0
- GRIB_latitudeOfFirstGridPointInDegrees :
- 90.0
- GRIB_latitudeOfLastGridPointInDegrees :
- -90.0
- GRIB_longitudeOfFirstGridPointInDegrees :
- 0.0
- GRIB_longitudeOfLastGridPointInDegrees :
- 359.75
- GRIB_missingValue :
- 3.4028234663852886e+38
- GRIB_name :
- 100 metre U wind component
- GRIB_numberOfPoints :
- 1038240
- GRIB_paramId :
- 228246
- GRIB_shortName :
- 100u
- GRIB_stepType :
- instant
- GRIB_stepUnits :
- 1
- GRIB_totalNumber :
- 0
- GRIB_typeOfLevel :
- surface
- GRIB_units :
- m s**-1
- GRIB_uvRelativeToGrid :
- 0
- long_name :
- 100 metre U wind component
- standard_name :
- unknown
- units :
- m s**-1
Array Chunk Bytes 2.86 TiB 67.50 MiB Shape (756768, 721, 1440) (4320, 64, 64) Dask graph 48576 chunks in 2 graph layers Data type float32 numpy.ndarray - u10n(valid_time, latitude, longitude)float32dask.array<chunksize=(4320, 64, 64), meta=np.ndarray>
- GRIB_NV :
- 0
- GRIB_Nx :
- 1440
- GRIB_Ny :
- 721
- GRIB_cfName :
- unknown
- GRIB_cfVarName :
- u10n
- GRIB_dataType :
- an
- GRIB_gridDefinitionDescription :
- Latitude/Longitude Grid
- GRIB_gridType :
- regular_ll
- GRIB_iDirectionIncrementInDegrees :
- 0.25
- GRIB_iScansNegatively :
- 0
- GRIB_jDirectionIncrementInDegrees :
- 0.25
- GRIB_jPointsAreConsecutive :
- 0
- GRIB_jScansPositively :
- 0
- GRIB_latitudeOfFirstGridPointInDegrees :
- 90.0
- GRIB_latitudeOfLastGridPointInDegrees :
- -90.0
- GRIB_longitudeOfFirstGridPointInDegrees :
- 0.0
- GRIB_longitudeOfLastGridPointInDegrees :
- 359.75
- GRIB_missingValue :
- 3.4028234663852886e+38
- GRIB_name :
- 10 metre u-component of neutral wind
- GRIB_numberOfPoints :
- 1038240
- GRIB_paramId :
- 228131
- GRIB_shortName :
- u10n
- GRIB_stepType :
- instant
- GRIB_stepUnits :
- 1
- GRIB_totalNumber :
- 0
- GRIB_typeOfLevel :
- surface
- GRIB_units :
- m s**-1
- GRIB_uvRelativeToGrid :
- 0
- long_name :
- 10 metre u-component of neutral wind
- standard_name :
- unknown
- units :
- m s**-1
Array Chunk Bytes 2.86 TiB 67.50 MiB Shape (756768, 721, 1440) (4320, 64, 64) Dask graph 48576 chunks in 2 graph layers Data type float32 numpy.ndarray - uvb(valid_time, latitude, longitude)float32dask.array<chunksize=(4320, 64, 64), meta=np.ndarray>
- GRIB_NV :
- 0
- GRIB_Nx :
- 1440
- GRIB_Ny :
- 721
- GRIB_cfName :
- unknown
- GRIB_cfVarName :
- uvb
- GRIB_dataType :
- fc
- GRIB_gridDefinitionDescription :
- Latitude/Longitude Grid
- GRIB_gridType :
- regular_ll
- GRIB_iDirectionIncrementInDegrees :
- 0.25
- GRIB_iScansNegatively :
- 0
- GRIB_jDirectionIncrementInDegrees :
- 0.25
- GRIB_jPointsAreConsecutive :
- 0
- GRIB_jScansPositively :
- 0
- GRIB_latitudeOfFirstGridPointInDegrees :
- 90.0
- GRIB_latitudeOfLastGridPointInDegrees :
- -90.0
- GRIB_longitudeOfFirstGridPointInDegrees :
- 0.0
- GRIB_longitudeOfLastGridPointInDegrees :
- 359.75
- GRIB_missingValue :
- 3.4028234663852886e+38
- GRIB_name :
- Surface downward UV radiation
- GRIB_numberOfPoints :
- 1038240
- GRIB_paramId :
- 57
- GRIB_shortName :
- uvb
- GRIB_stepType :
- accum
- GRIB_stepUnits :
- 1
- GRIB_totalNumber :
- 0
- GRIB_typeOfLevel :
- surface
- GRIB_units :
- J m**-2
- GRIB_uvRelativeToGrid :
- 0
- long_name :
- Surface downward UV radiation
- standard_name :
- unknown
- units :
- J m**-2
Array Chunk Bytes 2.86 TiB 67.50 MiB Shape (756768, 721, 1440) (4320, 64, 64) Dask graph 48576 chunks in 2 graph layers Data type float32 numpy.ndarray - v10(valid_time, latitude, longitude)float32dask.array<chunksize=(4320, 64, 64), meta=np.ndarray>
- GRIB_NV :
- 0
- GRIB_Nx :
- 1440
- GRIB_Ny :
- 721
- GRIB_cfName :
- unknown
- GRIB_cfVarName :
- v10
- GRIB_dataType :
- an
- GRIB_gridDefinitionDescription :
- Latitude/Longitude Grid
- GRIB_gridType :
- regular_ll
- GRIB_iDirectionIncrementInDegrees :
- 0.25
- GRIB_iScansNegatively :
- 0
- GRIB_jDirectionIncrementInDegrees :
- 0.25
- GRIB_jPointsAreConsecutive :
- 0
- GRIB_jScansPositively :
- 0
- GRIB_latitudeOfFirstGridPointInDegrees :
- 90.0
- GRIB_latitudeOfLastGridPointInDegrees :
- -90.0
- GRIB_longitudeOfFirstGridPointInDegrees :
- 0.0
- GRIB_longitudeOfLastGridPointInDegrees :
- 359.75
- GRIB_missingValue :
- 3.4028234663852886e+38
- GRIB_name :
- 10 metre V wind component
- GRIB_numberOfPoints :
- 1038240
- GRIB_paramId :
- 166
- GRIB_shortName :
- 10v
- GRIB_stepType :
- instant
- GRIB_stepUnits :
- 1
- GRIB_totalNumber :
- 0
- GRIB_typeOfLevel :
- surface
- GRIB_units :
- m s**-1
- GRIB_uvRelativeToGrid :
- 0
- long_name :
- 10 metre V wind component
- standard_name :
- unknown
- units :
- m s**-1
Array Chunk Bytes 2.86 TiB 67.50 MiB Shape (756768, 721, 1440) (4320, 64, 64) Dask graph 48576 chunks in 2 graph layers Data type float32 numpy.ndarray - v100(valid_time, latitude, longitude)float32dask.array<chunksize=(4320, 64, 64), meta=np.ndarray>
- GRIB_NV :
- 0
- GRIB_Nx :
- 1440
- GRIB_Ny :
- 721
- GRIB_cfName :
- unknown
- GRIB_cfVarName :
- v100
- GRIB_dataType :
- an
- GRIB_gridDefinitionDescription :
- Latitude/Longitude Grid
- GRIB_gridType :
- regular_ll
- GRIB_iDirectionIncrementInDegrees :
- 0.25
- GRIB_iScansNegatively :
- 0
- GRIB_jDirectionIncrementInDegrees :
- 0.25
- GRIB_jPointsAreConsecutive :
- 0
- GRIB_jScansPositively :
- 0
- GRIB_latitudeOfFirstGridPointInDegrees :
- 90.0
- GRIB_latitudeOfLastGridPointInDegrees :
- -90.0
- GRIB_longitudeOfFirstGridPointInDegrees :
- 0.0
- GRIB_longitudeOfLastGridPointInDegrees :
- 359.75
- GRIB_missingValue :
- 3.4028234663852886e+38
- GRIB_name :
- 100 metre V wind component
- GRIB_numberOfPoints :
- 1038240
- GRIB_paramId :
- 228247
- GRIB_shortName :
- 100v
- GRIB_stepType :
- instant
- GRIB_stepUnits :
- 1
- GRIB_totalNumber :
- 0
- GRIB_typeOfLevel :
- surface
- GRIB_units :
- m s**-1
- GRIB_uvRelativeToGrid :
- 0
- long_name :
- 100 metre V wind component
- standard_name :
- unknown
- units :
- m s**-1
Array Chunk Bytes 2.86 TiB 67.50 MiB Shape (756768, 721, 1440) (4320, 64, 64) Dask graph 48576 chunks in 2 graph layers Data type float32 numpy.ndarray - v10n(valid_time, latitude, longitude)float32dask.array<chunksize=(4320, 64, 64), meta=np.ndarray>
- GRIB_NV :
- 0
- GRIB_Nx :
- 1440
- GRIB_Ny :
- 721
- GRIB_cfName :
- unknown
- GRIB_cfVarName :
- v10n
- GRIB_dataType :
- an
- GRIB_gridDefinitionDescription :
- Latitude/Longitude Grid
- GRIB_gridType :
- regular_ll
- GRIB_iDirectionIncrementInDegrees :
- 0.25
- GRIB_iScansNegatively :
- 0
- GRIB_jDirectionIncrementInDegrees :
- 0.25
- GRIB_jPointsAreConsecutive :
- 0
- GRIB_jScansPositively :
- 0
- GRIB_latitudeOfFirstGridPointInDegrees :
- 90.0
- GRIB_latitudeOfLastGridPointInDegrees :
- -90.0
- GRIB_longitudeOfFirstGridPointInDegrees :
- 0.0
- GRIB_longitudeOfLastGridPointInDegrees :
- 359.75
- GRIB_missingValue :
- 3.4028234663852886e+38
- GRIB_name :
- 10 metre v-component of neutral wind
- GRIB_numberOfPoints :
- 1038240
- GRIB_paramId :
- 228132
- GRIB_shortName :
- v10n
- GRIB_stepType :
- instant
- GRIB_stepUnits :
- 1
- GRIB_totalNumber :
- 0
- GRIB_typeOfLevel :
- surface
- GRIB_units :
- m s**-1
- GRIB_uvRelativeToGrid :
- 0
- long_name :
- 10 metre v-component of neutral wind
- standard_name :
- unknown
- units :
- m s**-1
Array Chunk Bytes 2.86 TiB 67.50 MiB Shape (756768, 721, 1440) (4320, 64, 64) Dask graph 48576 chunks in 2 graph layers Data type float32 numpy.ndarray - viiwd(valid_time, latitude, longitude)float32dask.array<chunksize=(4320, 64, 64), meta=np.ndarray>
- GRIB_NV :
- 0
- GRIB_Nx :
- 1440
- GRIB_Ny :
- 721
- GRIB_cfName :
- unknown
- GRIB_cfVarName :
- viiwd
- GRIB_dataType :
- an
- GRIB_gridDefinitionDescription :
- Latitude/Longitude Grid
- GRIB_gridType :
- regular_ll
- GRIB_iDirectionIncrementInDegrees :
- 0.25
- GRIB_iScansNegatively :
- 0
- GRIB_jDirectionIncrementInDegrees :
- 0.25
- GRIB_jPointsAreConsecutive :
- 0
- GRIB_jScansPositively :
- 0
- GRIB_latitudeOfFirstGridPointInDegrees :
- 90.0
- GRIB_latitudeOfLastGridPointInDegrees :
- -90.0
- GRIB_longitudeOfFirstGridPointInDegrees :
- 0.0
- GRIB_longitudeOfLastGridPointInDegrees :
- 359.75
- GRIB_missingValue :
- 3.4028234663852886e+38
- GRIB_name :
- Total column vertically-integrated divergence of cloud frozen water flux
- GRIB_numberOfPoints :
- 1038240
- GRIB_paramId :
- 162080
- GRIB_shortName :
- viiwd
- GRIB_stepType :
- instant
- GRIB_stepUnits :
- 1
- GRIB_totalNumber :
- 0
- GRIB_typeOfLevel :
- entireAtmosphere
- GRIB_units :
- kg m**-2 s**-1
- GRIB_uvRelativeToGrid :
- 0
- long_name :
- Total column vertically-integrated divergence of cloud frozen water flux
- standard_name :
- unknown
- units :
- kg m**-2 s**-1
Array Chunk Bytes 2.86 TiB 67.50 MiB Shape (756768, 721, 1440) (4320, 64, 64) Dask graph 48576 chunks in 2 graph layers Data type float32 numpy.ndarray - viiwe(valid_time, latitude, longitude)float32dask.array<chunksize=(4320, 64, 64), meta=np.ndarray>
- GRIB_NV :
- 0
- GRIB_Nx :
- 1440
- GRIB_Ny :
- 721
- GRIB_cfName :
- unknown
- GRIB_cfVarName :
- viiwe
- GRIB_dataType :
- an
- GRIB_gridDefinitionDescription :
- Latitude/Longitude Grid
- GRIB_gridType :
- regular_ll
- GRIB_iDirectionIncrementInDegrees :
- 0.25
- GRIB_iScansNegatively :
- 0
- GRIB_jDirectionIncrementInDegrees :
- 0.25
- GRIB_jPointsAreConsecutive :
- 0
- GRIB_jScansPositively :
- 0
- GRIB_latitudeOfFirstGridPointInDegrees :
- 90.0
- GRIB_latitudeOfLastGridPointInDegrees :
- -90.0
- GRIB_longitudeOfFirstGridPointInDegrees :
- 0.0
- GRIB_longitudeOfLastGridPointInDegrees :
- 359.75
- GRIB_missingValue :
- 3.4028234663852886e+38
- GRIB_name :
- Total column vertically-integrated eastward cloud frozen water flux
- GRIB_numberOfPoints :
- 1038240
- GRIB_paramId :
- 162090
- GRIB_shortName :
- viiwe
- GRIB_stepType :
- instant
- GRIB_stepUnits :
- 1
- GRIB_totalNumber :
- 0
- GRIB_typeOfLevel :
- entireAtmosphere
- GRIB_units :
- kg m**-1 s**-1
- GRIB_uvRelativeToGrid :
- 0
- long_name :
- Total column vertically-integrated eastward cloud frozen water flux
- standard_name :
- unknown
- units :
- kg m**-1 s**-1
Array Chunk Bytes 2.86 TiB 67.50 MiB Shape (756768, 721, 1440) (4320, 64, 64) Dask graph 48576 chunks in 2 graph layers Data type float32 numpy.ndarray - viiwn(valid_time, latitude, longitude)float32dask.array<chunksize=(4320, 64, 64), meta=np.ndarray>
- GRIB_NV :
- 0
- GRIB_Nx :
- 1440
- GRIB_Ny :
- 721
- GRIB_cfName :
- unknown
- GRIB_cfVarName :
- viiwn
- GRIB_dataType :
- an
- GRIB_gridDefinitionDescription :
- Latitude/Longitude Grid
- GRIB_gridType :
- regular_ll
- GRIB_iDirectionIncrementInDegrees :
- 0.25
- GRIB_iScansNegatively :
- 0
- GRIB_jDirectionIncrementInDegrees :
- 0.25
- GRIB_jPointsAreConsecutive :
- 0
- GRIB_jScansPositively :
- 0
- GRIB_latitudeOfFirstGridPointInDegrees :
- 90.0
- GRIB_latitudeOfLastGridPointInDegrees :
- -90.0
- GRIB_longitudeOfFirstGridPointInDegrees :
- 0.0
- GRIB_longitudeOfLastGridPointInDegrees :
- 359.75
- GRIB_missingValue :
- 3.4028234663852886e+38
- GRIB_name :
- Total column vertically-integrated northward cloud frozen water flux
- GRIB_numberOfPoints :
- 1038240
- GRIB_paramId :
- 162091
- GRIB_shortName :
- viiwn
- GRIB_stepType :
- instant
- GRIB_stepUnits :
- 1
- GRIB_totalNumber :
- 0
- GRIB_typeOfLevel :
- entireAtmosphere
- GRIB_units :
- kg m**-1 s**-1
- GRIB_uvRelativeToGrid :
- 0
- long_name :
- Total column vertically-integrated northward cloud frozen water flux
- standard_name :
- unknown
- units :
- kg m**-1 s**-1
Array Chunk Bytes 2.86 TiB 67.50 MiB Shape (756768, 721, 1440) (4320, 64, 64) Dask graph 48576 chunks in 2 graph layers Data type float32 numpy.ndarray - vilwd(valid_time, latitude, longitude)float32dask.array<chunksize=(4320, 64, 64), meta=np.ndarray>
- GRIB_NV :
- 0
- GRIB_Nx :
- 1440
- GRIB_Ny :
- 721
- GRIB_cfName :
- unknown
- GRIB_cfVarName :
- vilwd
- GRIB_dataType :
- an
- GRIB_gridDefinitionDescription :
- Latitude/Longitude Grid
- GRIB_gridType :
- regular_ll
- GRIB_iDirectionIncrementInDegrees :
- 0.25
- GRIB_iScansNegatively :
- 0
- GRIB_jDirectionIncrementInDegrees :
- 0.25
- GRIB_jPointsAreConsecutive :
- 0
- GRIB_jScansPositively :
- 0
- GRIB_latitudeOfFirstGridPointInDegrees :
- 90.0
- GRIB_latitudeOfLastGridPointInDegrees :
- -90.0
- GRIB_longitudeOfFirstGridPointInDegrees :
- 0.0
- GRIB_longitudeOfLastGridPointInDegrees :
- 359.75
- GRIB_missingValue :
- 3.4028234663852886e+38
- GRIB_name :
- Total column vertically-integrated divergence of cloud liquid water flux
- GRIB_numberOfPoints :
- 1038240
- GRIB_paramId :
- 162079
- GRIB_shortName :
- vilwd
- GRIB_stepType :
- instant
- GRIB_stepUnits :
- 1
- GRIB_totalNumber :
- 0
- GRIB_typeOfLevel :
- entireAtmosphere
- GRIB_units :
- kg m**-2 s**-1
- GRIB_uvRelativeToGrid :
- 0
- long_name :
- Total column vertically-integrated divergence of cloud liquid water flux
- standard_name :
- unknown
- units :
- kg m**-2 s**-1
Array Chunk Bytes 2.86 TiB 67.50 MiB Shape (756768, 721, 1440) (4320, 64, 64) Dask graph 48576 chunks in 2 graph layers Data type float32 numpy.ndarray - vilwe(valid_time, latitude, longitude)float32dask.array<chunksize=(4320, 64, 64), meta=np.ndarray>
- GRIB_NV :
- 0
- GRIB_Nx :
- 1440
- GRIB_Ny :
- 721
- GRIB_cfName :
- unknown
- GRIB_cfVarName :
- vilwe
- GRIB_dataType :
- an
- GRIB_gridDefinitionDescription :
- Latitude/Longitude Grid
- GRIB_gridType :
- regular_ll
- GRIB_iDirectionIncrementInDegrees :
- 0.25
- GRIB_iScansNegatively :
- 0
- GRIB_jDirectionIncrementInDegrees :
- 0.25
- GRIB_jPointsAreConsecutive :
- 0
- GRIB_jScansPositively :
- 0
- GRIB_latitudeOfFirstGridPointInDegrees :
- 90.0
- GRIB_latitudeOfLastGridPointInDegrees :
- -90.0
- GRIB_longitudeOfFirstGridPointInDegrees :
- 0.0
- GRIB_longitudeOfLastGridPointInDegrees :
- 359.75
- GRIB_missingValue :
- 3.4028234663852886e+38
- GRIB_name :
- Total column vertically-integrated eastward cloud liquid water flux
- GRIB_numberOfPoints :
- 1038240
- GRIB_paramId :
- 162088
- GRIB_shortName :
- vilwe
- GRIB_stepType :
- instant
- GRIB_stepUnits :
- 1
- GRIB_totalNumber :
- 0
- GRIB_typeOfLevel :
- entireAtmosphere
- GRIB_units :
- kg m**-1 s**-1
- GRIB_uvRelativeToGrid :
- 0
- long_name :
- Total column vertically-integrated eastward cloud liquid water flux
- standard_name :
- unknown
- units :
- kg m**-1 s**-1
Array Chunk Bytes 2.86 TiB 67.50 MiB Shape (756768, 721, 1440) (4320, 64, 64) Dask graph 48576 chunks in 2 graph layers Data type float32 numpy.ndarray - vilwn(valid_time, latitude, longitude)float32dask.array<chunksize=(4320, 64, 64), meta=np.ndarray>
- GRIB_NV :
- 0
- GRIB_Nx :
- 1440
- GRIB_Ny :
- 721
- GRIB_cfName :
- unknown
- GRIB_cfVarName :
- vilwn
- GRIB_dataType :
- an
- GRIB_gridDefinitionDescription :
- Latitude/Longitude Grid
- GRIB_gridType :
- regular_ll
- GRIB_iDirectionIncrementInDegrees :
- 0.25
- GRIB_iScansNegatively :
- 0
- GRIB_jDirectionIncrementInDegrees :
- 0.25
- GRIB_jPointsAreConsecutive :
- 0
- GRIB_jScansPositively :
- 0
- GRIB_latitudeOfFirstGridPointInDegrees :
- 90.0
- GRIB_latitudeOfLastGridPointInDegrees :
- -90.0
- GRIB_longitudeOfFirstGridPointInDegrees :
- 0.0
- GRIB_longitudeOfLastGridPointInDegrees :
- 359.75
- GRIB_missingValue :
- 3.4028234663852886e+38
- GRIB_name :
- Total column vertically-integrated northward cloud liquid water flux
- GRIB_numberOfPoints :
- 1038240
- GRIB_paramId :
- 162089
- GRIB_shortName :
- vilwn
- GRIB_stepType :
- instant
- GRIB_stepUnits :
- 1
- GRIB_totalNumber :
- 0
- GRIB_typeOfLevel :
- entireAtmosphere
- GRIB_units :
- kg m**-1 s**-1
- GRIB_uvRelativeToGrid :
- 0
- long_name :
- Total column vertically-integrated northward cloud liquid water flux
- standard_name :
- unknown
- units :
- kg m**-1 s**-1
Array Chunk Bytes 2.86 TiB 67.50 MiB Shape (756768, 721, 1440) (4320, 64, 64) Dask graph 48576 chunks in 2 graph layers Data type float32 numpy.ndarray - z(valid_time, latitude, longitude)float32dask.array<chunksize=(4320, 64, 64), meta=np.ndarray>
- GRIB_NV :
- 0
- GRIB_Nx :
- 1440
- GRIB_Ny :
- 721
- GRIB_cfName :
- geopotential
- GRIB_cfVarName :
- z
- GRIB_dataType :
- an
- GRIB_gridDefinitionDescription :
- Latitude/Longitude Grid
- GRIB_gridType :
- regular_ll
- GRIB_iDirectionIncrementInDegrees :
- 0.25
- GRIB_iScansNegatively :
- 0
- GRIB_jDirectionIncrementInDegrees :
- 0.25
- GRIB_jPointsAreConsecutive :
- 0
- GRIB_jScansPositively :
- 0
- GRIB_latitudeOfFirstGridPointInDegrees :
- 90.0
- GRIB_latitudeOfLastGridPointInDegrees :
- -90.0
- GRIB_longitudeOfFirstGridPointInDegrees :
- 0.0
- GRIB_longitudeOfLastGridPointInDegrees :
- 359.75
- GRIB_missingValue :
- 3.4028234663852886e+38
- GRIB_name :
- Geopotential
- GRIB_numberOfPoints :
- 1038240
- GRIB_paramId :
- 129
- GRIB_shortName :
- z
- GRIB_stepType :
- instant
- GRIB_stepUnits :
- 1
- GRIB_totalNumber :
- 0
- GRIB_typeOfLevel :
- surface
- GRIB_units :
- m**2 s**-2
- GRIB_uvRelativeToGrid :
- 0
- long_name :
- Geopotential
- standard_name :
- geopotential
- units :
- m**2 s**-2
Array Chunk Bytes 2.86 TiB 67.50 MiB Shape (756768, 721, 1440) (4320, 64, 64) Dask graph 48576 chunks in 2 graph layers Data type float32 numpy.ndarray - zust(valid_time, latitude, longitude)float32dask.array<chunksize=(4320, 64, 64), meta=np.ndarray>
- GRIB_NV :
- 0
- GRIB_Nx :
- 1440
- GRIB_Ny :
- 721
- GRIB_cfName :
- unknown
- GRIB_cfVarName :
- zust
- GRIB_dataType :
- fc
- GRIB_gridDefinitionDescription :
- Latitude/Longitude Grid
- GRIB_gridType :
- regular_ll
- GRIB_iDirectionIncrementInDegrees :
- 0.25
- GRIB_iScansNegatively :
- 0
- GRIB_jDirectionIncrementInDegrees :
- 0.25
- GRIB_jPointsAreConsecutive :
- 0
- GRIB_jScansPositively :
- 0
- GRIB_latitudeOfFirstGridPointInDegrees :
- 90.0
- GRIB_latitudeOfLastGridPointInDegrees :
- -90.0
- GRIB_longitudeOfFirstGridPointInDegrees :
- 0.0
- GRIB_longitudeOfLastGridPointInDegrees :
- 359.75
- GRIB_missingValue :
- 3.4028234663852886e+38
- GRIB_name :
- Friction velocity
- GRIB_numberOfPoints :
- 1038240
- GRIB_paramId :
- 228003
- GRIB_shortName :
- zust
- GRIB_stepType :
- instant
- GRIB_stepUnits :
- 1
- GRIB_totalNumber :
- 0
- GRIB_typeOfLevel :
- surface
- GRIB_units :
- m s**-1
- GRIB_uvRelativeToGrid :
- 0
- long_name :
- Friction velocity
- standard_name :
- unknown
- units :
- m s**-1
Array Chunk Bytes 2.86 TiB 67.50 MiB Shape (756768, 721, 1440) (4320, 64, 64) Dask graph 48576 chunks in 2 graph layers Data type float32 numpy.ndarray
- Conventions :
- CF-1.7
- GRIB_centre :
- ecmf
- GRIB_centreDescription :
- European Centre for Medium-Range Weather Forecasts
- GRIB_edition :
- 1
- GRIB_subCentre :
- 0
- history :
- 2025-12-04T16:25 GRIB to CDM+CF via cfgrib-0.9.15.0/ecCodes-2.43.0 with {"source": ".xarray-ecmwf-cache/bff222b88be7ee38639dfb3fee0ac442.grib", "filter_by_keys": {}, "encode_cf": ["parameter", "time", "geography", "vertical"]}
- institution :
- European Centre for Medium-Range Weather Forecasts
⚠ At this point, no data has been downloaded yet, nor loaded in memory.
2. Data selection#
Average 2 metre temperature in Germany, October 2023#
First, we perform a geographical selection corresponding to the Germany area. This greatly reduces the amount of data that will be downloaded from EDH. Also, we convert the temperature to °C.
[ ]:
t2m = ds.t2m
t2m_germany= t2m.sel(**{"latitude": slice(55, 47), "longitude": slice(5, 16)})
t2m_germany
<xarray.DataArray 't2m' (valid_time: 756768, latitude: 33, longitude: 45)> Size: 4GB
dask.array<getitem, shape=(756768, 33, 45), dtype=float32, chunksize=(4320, 33, 44), chunktype=numpy.ndarray>
Coordinates:
  * valid_time  (valid_time) datetime64[ns] 6MB 1940-01-01 ... 2026-04-30T23:...
  * latitude    (latitude) float64 264B 55.0 54.75 54.5 ... 47.5 47.25 47.0
  * longitude   (longitude) float64 360B 5.0 5.25 5.5 5.75 ... 15.5 15.75 16.0
    number      int64 8B ...
    surface     float64 8B ...
Attributes: (12/31)
    GRIB_NV:                                  0
    GRIB_Nx:                                  1440
    GRIB_Ny:                                  721
    GRIB_cfName:                              unknown
    GRIB_cfVarName:                           t2m
    GRIB_dataType:                            an
    ...                                       ...
    GRIB_typeOfLevel:                         surface
    GRIB_units:                               K
    GRIB_uvRelativeToGrid:                    0
    long_name:                                2 metre temperature
    standard_name:                            unknown
units: K- valid_time: 756768
- latitude: 33
- longitude: 45
- dask.array<chunksize=(4320, 33, 44), meta=np.ndarray>
Array Chunk Bytes 4.19 GiB 23.93 MiB Shape (756768, 33, 45) (4320, 33, 44) Dask graph 352 chunks in 3 graph layers Data type float32 numpy.ndarray - valid_time(valid_time)datetime64[ns]1940-01-01 ... 2026-04-30T23:00:00
array(['1940-01-01T00:00:00.000000000', '1940-01-01T01:00:00.000000000', '1940-01-01T02:00:00.000000000', ..., '2026-04-30T21:00:00.000000000', '2026-04-30T22:00:00.000000000', '2026-04-30T23:00:00.000000000'], shape=(756768,), dtype='datetime64[ns]') - latitude(latitude)float6455.0 54.75 54.5 ... 47.5 47.25 47.0
- long_name :
- latitude
- standard_name :
- latitude
- stored_direction :
- decreasing
- units :
- degrees_north
array([55. , 54.75, 54.5 , 54.25, 54. , 53.75, 53.5 , 53.25, 53. , 52.75, 52.5 , 52.25, 52. , 51.75, 51.5 , 51.25, 51. , 50.75, 50.5 , 50.25, 50. , 49.75, 49.5 , 49.25, 49. , 48.75, 48.5 , 48.25, 48. , 47.75, 47.5 , 47.25, 47. ]) - longitude(longitude)float645.0 5.25 5.5 ... 15.5 15.75 16.0
- long_name :
- longitude
- standard_name :
- longitude
- units :
- degrees_east
array([ 5. , 5.25, 5.5 , 5.75, 6. , 6.25, 6.5 , 6.75, 7. , 7.25, 7.5 , 7.75, 8. , 8.25, 8.5 , 8.75, 9. , 9.25, 9.5 , 9.75, 10. , 10.25, 10.5 , 10.75, 11. , 11.25, 11.5 , 11.75, 12. , 12.25, 12.5 , 12.75, 13. , 13.25, 13.5 , 13.75, 14. , 14.25, 14.5 , 14.75, 15. , 15.25, 15.5 , 15.75, 16. ]) - number()int64...
- long_name :
- ensemble member numerical id
- standard_name :
- realization
- units :
- 1
[1 values with dtype=int64]
- surface()float64...
- long_name :
- original GRIB coordinate for key: level(surface)
- units :
- 1
[1 values with dtype=float64]
- GRIB_NV :
- 0
- GRIB_Nx :
- 1440
- GRIB_Ny :
- 721
- GRIB_cfName :
- unknown
- GRIB_cfVarName :
- t2m
- GRIB_dataType :
- an
- GRIB_gridDefinitionDescription :
- Latitude/Longitude Grid
- GRIB_gridType :
- regular_ll
- GRIB_iDirectionIncrementInDegrees :
- 0.25
- GRIB_iScansNegatively :
- 0
- GRIB_jDirectionIncrementInDegrees :
- 0.25
- GRIB_jPointsAreConsecutive :
- 0
- GRIB_jScansPositively :
- 0
- GRIB_latitudeOfFirstGridPointInDegrees :
- 90.0
- GRIB_latitudeOfLastGridPointInDegrees :
- -90.0
- GRIB_longitudeOfFirstGridPointInDegrees :
- 0.0
- GRIB_longitudeOfLastGridPointInDegrees :
- 359.75
- GRIB_missingValue :
- 3.4028234663852886e+38
- GRIB_name :
- 2 metre temperature
- GRIB_numberOfPoints :
- 1038240
- GRIB_paramId :
- 167
- GRIB_shortName :
- 2t
- GRIB_stepType :
- instant
- GRIB_stepUnits :
- 1
- GRIB_totalNumber :
- 0
- GRIB_typeOfLevel :
- surface
- GRIB_units :
- K
- GRIB_uvRelativeToGrid :
- 0
- long_name :
- 2 metre temperature
- standard_name :
- unknown
- units :
- K
Second, we further select the October 2023 month. This is, again, a lazy operation:
[ ]:
t2m_germany_october_2023 = t2m_germany.sel(valid_time="2023-10")
t2m_germany_october_2023
<xarray.DataArray 't2m' (valid_time: 744, latitude: 33, longitude: 45)> Size: 4MB
dask.array<getitem, shape=(744, 33, 45), dtype=float32, chunksize=(480, 33, 44), chunktype=numpy.ndarray>
Coordinates:
  * valid_time  (valid_time) datetime64[ns] 6kB 2023-10-01 ... 2023-10-31T23:...
  * latitude    (latitude) float64 264B 55.0 54.75 54.5 ... 47.5 47.25 47.0
  * longitude   (longitude) float64 360B 5.0 5.25 5.5 5.75 ... 15.5 15.75 16.0
    number      int64 8B ...
    surface     float64 8B ...
Attributes: (12/31)
    GRIB_NV:                                  0
    GRIB_Nx:                                  1440
    GRIB_Ny:                                  721
    GRIB_cfName:                              unknown
    GRIB_cfVarName:                           t2m
    GRIB_dataType:                            an
    ...                                       ...
    GRIB_typeOfLevel:                         surface
    GRIB_units:                               K
    GRIB_uvRelativeToGrid:                    0
    long_name:                                2 metre temperature
    standard_name:                            unknown
units: K- valid_time: 744
- latitude: 33
- longitude: 45
- dask.array<chunksize=(264, 33, 44), meta=np.ndarray>
Array Chunk Bytes 4.21 MiB 2.66 MiB Shape (744, 33, 45) (480, 33, 44) Dask graph 4 chunks in 4 graph layers Data type float32 numpy.ndarray - valid_time(valid_time)datetime64[ns]2023-10-01 ... 2023-10-31T23:00:00
array(['2023-10-01T00:00:00.000000000', '2023-10-01T01:00:00.000000000', '2023-10-01T02:00:00.000000000', ..., '2023-10-31T21:00:00.000000000', '2023-10-31T22:00:00.000000000', '2023-10-31T23:00:00.000000000'], shape=(744,), dtype='datetime64[ns]') - latitude(latitude)float6455.0 54.75 54.5 ... 47.5 47.25 47.0
- long_name :
- latitude
- standard_name :
- latitude
- stored_direction :
- decreasing
- units :
- degrees_north
array([55. , 54.75, 54.5 , 54.25, 54. , 53.75, 53.5 , 53.25, 53. , 52.75, 52.5 , 52.25, 52. , 51.75, 51.5 , 51.25, 51. , 50.75, 50.5 , 50.25, 50. , 49.75, 49.5 , 49.25, 49. , 48.75, 48.5 , 48.25, 48. , 47.75, 47.5 , 47.25, 47. ]) - longitude(longitude)float645.0 5.25 5.5 ... 15.5 15.75 16.0
- long_name :
- longitude
- standard_name :
- longitude
- units :
- degrees_east
array([ 5. , 5.25, 5.5 , 5.75, 6. , 6.25, 6.5 , 6.75, 7. , 7.25, 7.5 , 7.75, 8. , 8.25, 8.5 , 8.75, 9. , 9.25, 9.5 , 9.75, 10. , 10.25, 10.5 , 10.75, 11. , 11.25, 11.5 , 11.75, 12. , 12.25, 12.5 , 12.75, 13. , 13.25, 13.5 , 13.75, 14. , 14.25, 14.5 , 14.75, 15. , 15.25, 15.5 , 15.75, 16. ]) - number()int64...
- long_name :
- ensemble member numerical id
- standard_name :
- realization
- units :
- 1
[1 values with dtype=int64]
- surface()float64...
- long_name :
- original GRIB coordinate for key: level(surface)
- units :
- 1
[1 values with dtype=float64]
- GRIB_NV :
- 0
- GRIB_Nx :
- 1440
- GRIB_Ny :
- 721
- GRIB_cfName :
- unknown
- GRIB_cfVarName :
- t2m
- GRIB_dataType :
- an
- GRIB_gridDefinitionDescription :
- Latitude/Longitude Grid
- GRIB_gridType :
- regular_ll
- GRIB_iDirectionIncrementInDegrees :
- 0.25
- GRIB_iScansNegatively :
- 0
- GRIB_jDirectionIncrementInDegrees :
- 0.25
- GRIB_jPointsAreConsecutive :
- 0
- GRIB_jScansPositively :
- 0
- GRIB_latitudeOfFirstGridPointInDegrees :
- 90.0
- GRIB_latitudeOfLastGridPointInDegrees :
- -90.0
- GRIB_longitudeOfFirstGridPointInDegrees :
- 0.0
- GRIB_longitudeOfLastGridPointInDegrees :
- 359.75
- GRIB_missingValue :
- 3.4028234663852886e+38
- GRIB_name :
- 2 metre temperature
- GRIB_numberOfPoints :
- 1038240
- GRIB_paramId :
- 167
- GRIB_shortName :
- 2t
- GRIB_stepType :
- instant
- GRIB_stepUnits :
- 1
- GRIB_totalNumber :
- 0
- GRIB_typeOfLevel :
- surface
- GRIB_units :
- K
- GRIB_uvRelativeToGrid :
- 0
- long_name :
- 2 metre temperature
- standard_name :
- unknown
- units :
- K
3. Data download#
Due to the chunked structure of the DataArray, xarray will must download every chunk that includes a portion of the selected data.
To estimate the size of the download, we can use the costing.py module. This estimate must be done before we apply any reduction operation.
[ ]:
import costing

costing.estimate_download_size(t2m_germany_october_2023)
Estimated download size: 0.053 GiB (54.0 MiB)
At this point the selection is small enough to call compute() on it. This will trigger the download of data from EDH and load it in memory.
Remember to assign the return of the compute() function to a new variable, so that the data is kept in memory.
We can measure the time it takes:
[ ]:
%%time

t2m_germany_october_2023_computed = t2m_germany_october_2023.compute()
CPU times: user 1.21 s, sys: 617 ms, total: 1.83 s
Wall time: 1.82 s
The data was very small, this didn’t take long!
4. Data reduction#
Now that the data is loaded in memory, we can easily compute the october 2023 monthly mean:
[ ]:
t2m_germany_october_2023_monthly_mean = t2m_germany_october_2023_computed.mean(dim="valid_time")
t2m_germany_october_2023_monthly_mean
<xarray.DataArray 't2m' (latitude: 33, longitude: 45)> Size: 6kB
array([[286.47546, 286.53998, 286.57492, ..., 285.4076 , 285.43448,
        285.4543 ],
       [286.7641 , 286.81418, 286.83   , ..., 285.6875 , 285.64215,
        285.66263],
       [287.0084 , 287.0531 , 287.0645 , ..., 285.72546, 285.6559 ,
        285.34106],
       ...,
       [286.68146, 287.18817, 287.58133, ..., 283.16397, 283.88876,
        285.1465 ],
       [287.26074, 287.77957, 288.1606 , ..., 284.7006 , 285.42273,
        285.88272],
       [287.9933 , 288.20767, 288.4106 , ..., 286.21405, 286.82727,
        287.0215 ]], shape=(33, 45), dtype=float32)
Coordinates:
  * latitude   (latitude) float64 264B 55.0 54.75 54.5 54.25 ... 47.5 47.25 47.0
  * longitude  (longitude) float64 360B 5.0 5.25 5.5 5.75 ... 15.5 15.75 16.0
    number     int64 8B 0
    surface    float64 8B 0.0
Attributes: (12/31)
    GRIB_NV:                                  0
    GRIB_Nx:                                  1440
    GRIB_Ny:                                  721
    GRIB_cfName:                              unknown
    GRIB_cfVarName:                           t2m
    GRIB_dataType:                            an
    ...                                       ...
    GRIB_typeOfLevel:                         surface
    GRIB_units:                               K
    GRIB_uvRelativeToGrid:                    0
    long_name:                                2 metre temperature
    standard_name:                            unknown
units: K- latitude: 33
- longitude: 45
- 286.5 286.5 286.6 286.6 286.6 286.7 ... 284.2 285.4 286.2 286.8 287.0
array([[286.47546, 286.53998, 286.57492, ..., 285.4076 , 285.43448, 285.4543 ], [286.7641 , 286.81418, 286.83 , ..., 285.6875 , 285.64215, 285.66263], [287.0084 , 287.0531 , 287.0645 , ..., 285.72546, 285.6559 , 285.34106], ..., [286.68146, 287.18817, 287.58133, ..., 283.16397, 283.88876, 285.1465 ], [287.26074, 287.77957, 288.1606 , ..., 284.7006 , 285.42273, 285.88272], [287.9933 , 288.20767, 288.4106 , ..., 286.21405, 286.82727, 287.0215 ]], shape=(33, 45), dtype=float32) - latitude(latitude)float6455.0 54.75 54.5 ... 47.5 47.25 47.0
- long_name :
- latitude
- standard_name :
- latitude
- stored_direction :
- decreasing
- units :
- degrees_north
array([55. , 54.75, 54.5 , 54.25, 54. , 53.75, 53.5 , 53.25, 53. , 52.75, 52.5 , 52.25, 52. , 51.75, 51.5 , 51.25, 51. , 50.75, 50.5 , 50.25, 50. , 49.75, 49.5 , 49.25, 49. , 48.75, 48.5 , 48.25, 48. , 47.75, 47.5 , 47.25, 47. ]) - longitude(longitude)float645.0 5.25 5.5 ... 15.5 15.75 16.0
- long_name :
- longitude
- standard_name :
- longitude
- units :
- degrees_east
array([ 5. , 5.25, 5.5 , 5.75, 6. , 6.25, 6.5 , 6.75, 7. , 7.25, 7.5 , 7.75, 8. , 8.25, 8.5 , 8.75, 9. , 9.25, 9.5 , 9.75, 10. , 10.25, 10.5 , 10.75, 11. , 11.25, 11.5 , 11.75, 12. , 12.25, 12.5 , 12.75, 13. , 13.25, 13.5 , 13.75, 14. , 14.25, 14.5 , 14.75, 15. , 15.25, 15.5 , 15.75, 16. ]) - number()int640
- long_name :
- ensemble member numerical id
- standard_name :
- realization
- units :
- 1
array(0)
- surface()float640.0
- long_name :
- original GRIB coordinate for key: level(surface)
- units :
- 1
array(0.)
- GRIB_NV :
- 0
- GRIB_Nx :
- 1440
- GRIB_Ny :
- 721
- GRIB_cfName :
- unknown
- GRIB_cfVarName :
- t2m
- GRIB_dataType :
- an
- GRIB_gridDefinitionDescription :
- Latitude/Longitude Grid
- GRIB_gridType :
- regular_ll
- GRIB_iDirectionIncrementInDegrees :
- 0.25
- GRIB_iScansNegatively :
- 0
- GRIB_jDirectionIncrementInDegrees :
- 0.25
- GRIB_jPointsAreConsecutive :
- 0
- GRIB_jScansPositively :
- 0
- GRIB_latitudeOfFirstGridPointInDegrees :
- 90.0
- GRIB_latitudeOfLastGridPointInDegrees :
- -90.0
- GRIB_longitudeOfFirstGridPointInDegrees :
- 0.0
- GRIB_longitudeOfLastGridPointInDegrees :
- 359.75
- GRIB_missingValue :
- 3.4028234663852886e+38
- GRIB_name :
- 2 metre temperature
- GRIB_numberOfPoints :
- 1038240
- GRIB_paramId :
- 167
- GRIB_shortName :
- 2t
- GRIB_stepType :
- instant
- GRIB_stepUnits :
- 1
- GRIB_totalNumber :
- 0
- GRIB_typeOfLevel :
- surface
- GRIB_units :
- K
- GRIB_uvRelativeToGrid :
- 0
- long_name :
- 2 metre temperature
- standard_name :
- unknown
- units :
- K
5. Visualisation#
Finally, we can plot the october 2023 monthly mean on a map:
[ ]:
import display
import matplotlib.pyplot as plt
from cartopy import crs
[ ]:
t2m_germany_october_2023_monthly_mean_degC = t2m_germany_october_2023_monthly_mean - 273.15
t2m_germany_october_2023_monthly_mean_degC.attrs["units"] = "°C"

display.map(
    t2m_germany_october_2023_monthly_mean_degC,
    projection=crs.Miller(),
    vmax=None,
    cmap="YlOrRd",
    title="Mean Surface Temperature, Oct 2023"
);
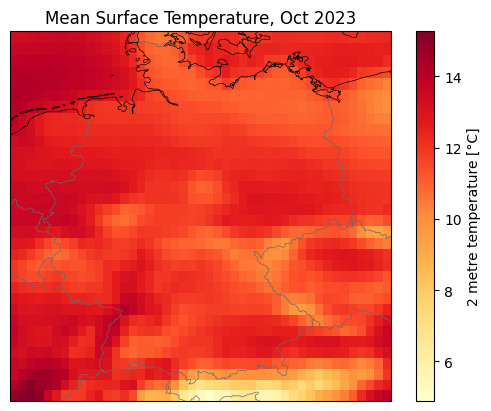
2 metre temperature anomaly in Germany, October 2023#
We want to compute the 2 metre temperature anomaly for the month of October 2023 against the 1991-2020 reference period, once again in Germany. The same considerations done before apply here.
We fist select the relevant months in the reference period:
[ ]:
t2m_germany_octobers_1991_2020 = t2m_germany.sel(valid_time=t2m_germany["valid_time.month"] == 10).sel(valid_time=slice("1991", "2020"))
t2m_germany_octobers_1991_2020
<xarray.DataArray 't2m' (valid_time: 22320, latitude: 33, longitude: 45)> Size: 133MB
dask.array<getitem, shape=(22320, 33, 45), dtype=float32, chunksize=(4299, 33, 44), chunktype=numpy.ndarray>
Coordinates:
  * valid_time  (valid_time) datetime64[ns] 179kB 1991-10-01 ... 2020-10-31T2...
  * latitude    (latitude) float64 264B 55.0 54.75 54.5 ... 47.5 47.25 47.0
  * longitude   (longitude) float64 360B 5.0 5.25 5.5 5.75 ... 15.5 15.75 16.0
    number      int64 8B ...
    surface     float64 8B ...
Attributes: (12/31)
    GRIB_NV:                                  0
    GRIB_Nx:                                  1440
    GRIB_Ny:                                  721
    GRIB_cfName:                              unknown
    GRIB_cfVarName:                           t2m
    GRIB_dataType:                            an
    ...                                       ...
    GRIB_typeOfLevel:                         surface
    GRIB_units:                               K
    GRIB_uvRelativeToGrid:                    0
    long_name:                                2 metre temperature
    standard_name:                            unknown
units: K- valid_time: 22320
- latitude: 33
- longitude: 45
- dask.array<chunksize=(747, 33, 44), meta=np.ndarray>
Array Chunk Bytes 126.44 MiB 23.81 MiB Shape (22320, 33, 45) (4299, 33, 44) Dask graph 14 chunks in 5 graph layers Data type float32 numpy.ndarray - valid_time(valid_time)datetime64[ns]1991-10-01 ... 2020-10-31T23:00:00
array(['1991-10-01T00:00:00.000000000', '1991-10-01T01:00:00.000000000', '1991-10-01T02:00:00.000000000', ..., '2020-10-31T21:00:00.000000000', '2020-10-31T22:00:00.000000000', '2020-10-31T23:00:00.000000000'], shape=(22320,), dtype='datetime64[ns]') - latitude(latitude)float6455.0 54.75 54.5 ... 47.5 47.25 47.0
- long_name :
- latitude
- standard_name :
- latitude
- stored_direction :
- decreasing
- units :
- degrees_north
array([55. , 54.75, 54.5 , 54.25, 54. , 53.75, 53.5 , 53.25, 53. , 52.75, 52.5 , 52.25, 52. , 51.75, 51.5 , 51.25, 51. , 50.75, 50.5 , 50.25, 50. , 49.75, 49.5 , 49.25, 49. , 48.75, 48.5 , 48.25, 48. , 47.75, 47.5 , 47.25, 47. ]) - longitude(longitude)float645.0 5.25 5.5 ... 15.5 15.75 16.0
- long_name :
- longitude
- standard_name :
- longitude
- units :
- degrees_east
array([ 5. , 5.25, 5.5 , 5.75, 6. , 6.25, 6.5 , 6.75, 7. , 7.25, 7.5 , 7.75, 8. , 8.25, 8.5 , 8.75, 9. , 9.25, 9.5 , 9.75, 10. , 10.25, 10.5 , 10.75, 11. , 11.25, 11.5 , 11.75, 12. , 12.25, 12.5 , 12.75, 13. , 13.25, 13.5 , 13.75, 14. , 14.25, 14.5 , 14.75, 15. , 15.25, 15.5 , 15.75, 16. ]) - number()int64...
- long_name :
- ensemble member numerical id
- standard_name :
- realization
- units :
- 1
[1 values with dtype=int64]
- surface()float64...
- long_name :
- original GRIB coordinate for key: level(surface)
- units :
- 1
[1 values with dtype=float64]
- GRIB_NV :
- 0
- GRIB_Nx :
- 1440
- GRIB_Ny :
- 721
- GRIB_cfName :
- unknown
- GRIB_cfVarName :
- t2m
- GRIB_dataType :
- an
- GRIB_gridDefinitionDescription :
- Latitude/Longitude Grid
- GRIB_gridType :
- regular_ll
- GRIB_iDirectionIncrementInDegrees :
- 0.25
- GRIB_iScansNegatively :
- 0
- GRIB_jDirectionIncrementInDegrees :
- 0.25
- GRIB_jPointsAreConsecutive :
- 0
- GRIB_jScansPositively :
- 0
- GRIB_latitudeOfFirstGridPointInDegrees :
- 90.0
- GRIB_latitudeOfLastGridPointInDegrees :
- -90.0
- GRIB_longitudeOfFirstGridPointInDegrees :
- 0.0
- GRIB_longitudeOfLastGridPointInDegrees :
- 359.75
- GRIB_missingValue :
- 3.4028234663852886e+38
- GRIB_name :
- 2 metre temperature
- GRIB_numberOfPoints :
- 1038240
- GRIB_paramId :
- 167
- GRIB_shortName :
- 2t
- GRIB_stepType :
- instant
- GRIB_stepUnits :
- 1
- GRIB_totalNumber :
- 0
- GRIB_typeOfLevel :
- surface
- GRIB_units :
- K
- GRIB_uvRelativeToGrid :
- 0
- long_name :
- 2 metre temperature
- standard_name :
- unknown
- units :
- K
[ ]:
import costing

costing.estimate_download_size(t2m_germany_octobers_1991_2020)
Estimated download size: 0.185 GiB (189.0 MiB)
This is small enough to be computed in reasonable time:
[ ]:
%%time

t2m_germany_octobers_1991_2020_computed = t2m_germany_octobers_1991_2020.compute()
CPU times: user 17.3 s, sys: 10.3 s, total: 27.6 s
Wall time: 19.2 s
Now that the data is loaded in memory we can easily compute the 1991-2020 octobers mean:
[ ]:
t2m_germany_octobers_1991_2020_mean = t2m_germany_octobers_1991_2020_computed.mean(dim="valid_time")
And finally the anomaly:
[ ]:
anomaly = t2m_germany_october_2023_monthly_mean - t2m_germany_octobers_1991_2020_mean
anomaly
<xarray.DataArray 't2m' (latitude: 33, longitude: 45)> Size: 6kB
array([[0.94332886, 0.9750061 , 0.97927856, ..., 1.1030273 , 1.1482239 ,
        1.1797485 ],
       [1.0574036 , 1.0711365 , 1.076477  , ..., 1.3132019 , 1.3067627 ,
        1.3421631 ],
       [1.1593323 , 1.1647949 , 1.183075  , ..., 1.4459839 , 1.4371948 ,
        1.3749695 ],
       ...,
       [2.6353455 , 2.6623535 , 2.8293152 , ..., 3.3908386 , 3.532074  ,
        3.6781006 ],
       [2.7051392 , 2.7347107 , 2.8860168 , ..., 3.2903442 , 3.42453   ,
        3.572113  ],
       [2.8457642 , 2.8259888 , 2.9132385 , ..., 3.4275208 , 3.498291  ,
        3.6354065 ]], shape=(33, 45), dtype=float32)
Coordinates:
  * latitude   (latitude) float64 264B 55.0 54.75 54.5 54.25 ... 47.5 47.25 47.0
  * longitude  (longitude) float64 360B 5.0 5.25 5.5 5.75 ... 15.5 15.75 16.0
    number     int64 8B 0
    surface    float64 8B 0.0
Attributes: (12/31)
    GRIB_NV:                                  0
    GRIB_Nx:                                  1440
    GRIB_Ny:                                  721
    GRIB_cfName:                              unknown
    GRIB_cfVarName:                           t2m
    GRIB_dataType:                            an
    ...                                       ...
    GRIB_typeOfLevel:                         surface
    GRIB_units:                               K
    GRIB_uvRelativeToGrid:                    0
    long_name:                                2 metre temperature
    standard_name:                            unknown
units: K- latitude: 33
- longitude: 45
- 0.9433 0.975 0.9793 0.9817 0.9621 ... 3.378 3.369 3.428 3.498 3.635
array([[0.94332886, 0.9750061 , 0.97927856, ..., 1.1030273 , 1.1482239 , 1.1797485 ], [1.0574036 , 1.0711365 , 1.076477 , ..., 1.3132019 , 1.3067627 , 1.3421631 ], [1.1593323 , 1.1647949 , 1.183075 , ..., 1.4459839 , 1.4371948 , 1.3749695 ], ..., [2.6353455 , 2.6623535 , 2.8293152 , ..., 3.3908386 , 3.532074 , 3.6781006 ], [2.7051392 , 2.7347107 , 2.8860168 , ..., 3.2903442 , 3.42453 , 3.572113 ], [2.8457642 , 2.8259888 , 2.9132385 , ..., 3.4275208 , 3.498291 , 3.6354065 ]], shape=(33, 45), dtype=float32) - latitude(latitude)float6455.0 54.75 54.5 ... 47.5 47.25 47.0
- long_name :
- latitude
- standard_name :
- latitude
- stored_direction :
- decreasing
- units :
- degrees_north
array([55. , 54.75, 54.5 , 54.25, 54. , 53.75, 53.5 , 53.25, 53. , 52.75, 52.5 , 52.25, 52. , 51.75, 51.5 , 51.25, 51. , 50.75, 50.5 , 50.25, 50. , 49.75, 49.5 , 49.25, 49. , 48.75, 48.5 , 48.25, 48. , 47.75, 47.5 , 47.25, 47. ]) - longitude(longitude)float645.0 5.25 5.5 ... 15.5 15.75 16.0
- long_name :
- longitude
- standard_name :
- longitude
- units :
- degrees_east
array([ 5. , 5.25, 5.5 , 5.75, 6. , 6.25, 6.5 , 6.75, 7. , 7.25, 7.5 , 7.75, 8. , 8.25, 8.5 , 8.75, 9. , 9.25, 9.5 , 9.75, 10. , 10.25, 10.5 , 10.75, 11. , 11.25, 11.5 , 11.75, 12. , 12.25, 12.5 , 12.75, 13. , 13.25, 13.5 , 13.75, 14. , 14.25, 14.5 , 14.75, 15. , 15.25, 15.5 , 15.75, 16. ]) - number()int640
- long_name :
- ensemble member numerical id
- standard_name :
- realization
- units :
- 1
array(0)
- surface()float640.0
- long_name :
- original GRIB coordinate for key: level(surface)
- units :
- 1
array(0.)
- GRIB_NV :
- 0
- GRIB_Nx :
- 1440
- GRIB_Ny :
- 721
- GRIB_cfName :
- unknown
- GRIB_cfVarName :
- t2m
- GRIB_dataType :
- an
- GRIB_gridDefinitionDescription :
- Latitude/Longitude Grid
- GRIB_gridType :
- regular_ll
- GRIB_iDirectionIncrementInDegrees :
- 0.25
- GRIB_iScansNegatively :
- 0
- GRIB_jDirectionIncrementInDegrees :
- 0.25
- GRIB_jPointsAreConsecutive :
- 0
- GRIB_jScansPositively :
- 0
- GRIB_latitudeOfFirstGridPointInDegrees :
- 90.0
- GRIB_latitudeOfLastGridPointInDegrees :
- -90.0
- GRIB_longitudeOfFirstGridPointInDegrees :
- 0.0
- GRIB_longitudeOfLastGridPointInDegrees :
- 359.75
- GRIB_missingValue :
- 3.4028234663852886e+38
- GRIB_name :
- 2 metre temperature
- GRIB_numberOfPoints :
- 1038240
- GRIB_paramId :
- 167
- GRIB_shortName :
- 2t
- GRIB_stepType :
- instant
- GRIB_stepUnits :
- 1
- GRIB_totalNumber :
- 0
- GRIB_typeOfLevel :
- surface
- GRIB_units :
- K
- GRIB_uvRelativeToGrid :
- 0
- long_name :
- 2 metre temperature
- standard_name :
- unknown
- units :
- K
We can plot the anomaly on a map:
[ ]:
anomaly.attrs["units"] = "°C"

display.map(
    anomaly,
    vmax=None,
    projection=crs.Miller(),
    cmap="YlOrRd",
    title="Mean Surface Temperature anomaly (ref 1991-2020), Oct 2013"
);
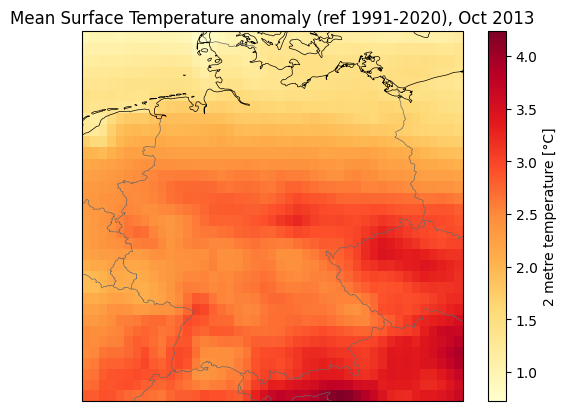
2 metre temperature climatology (1991-2020) in Berlin vs 2023 monthly mean#
The power of Earth Data Hub is better shown when working with timeseries. We will now show how fast is to compute the 2 metre temperature climatology (monthly mean and standard deviation) in Berlin, over the reference period 1991-2020, and compare it with the 2023 monthly means.
With legacy data distributon systems you would need to download the entire world temperature for the reference time period, extract the Berlin data and do your calculations. Alternatively the data provider might do a crop and merge operation for you, but chances are that this is very slow (internally the data provider still accesses the entire world temperature, you just don’t see it!). Thanks to Earth Data Hub this is not needed anymore. You only need to download the relevant chunks.
Here, we select the closest data to Berlin:
[ ]:
t2m_Berlin = t2m.sel(**{"latitude": 52.5, "longitude": 13.4}, method="nearest")
t2m_Berlin
<xarray.DataArray 't2m' (valid_time: 756768)> Size: 3MB
dask.array<getitem, shape=(756768,), dtype=float32, chunksize=(4320,), chunktype=numpy.ndarray>
Coordinates:
  * valid_time  (valid_time) datetime64[ns] 6MB 1940-01-01 ... 2026-04-30T23:...
    latitude    float64 8B 52.5
    longitude   float64 8B 13.5
    number      int64 8B ...
    surface     float64 8B ...
Attributes: (12/31)
    GRIB_NV:                                  0
    GRIB_Nx:                                  1440
    GRIB_Ny:                                  721
    GRIB_cfName:                              unknown
    GRIB_cfVarName:                           t2m
    GRIB_dataType:                            an
    ...                                       ...
    GRIB_typeOfLevel:                         surface
    GRIB_units:                               K
    GRIB_uvRelativeToGrid:                    0
    long_name:                                2 metre temperature
    standard_name:                            unknown
units: K- valid_time: 756768
- dask.array<chunksize=(4320,), meta=np.ndarray>
Array Chunk Bytes 2.89 MiB 16.88 kiB Shape (756768,) (4320,) Dask graph 176 chunks in 3 graph layers Data type float32 numpy.ndarray - valid_time(valid_time)datetime64[ns]1940-01-01 ... 2026-04-30T23:00:00
array(['1940-01-01T00:00:00.000000000', '1940-01-01T01:00:00.000000000', '1940-01-01T02:00:00.000000000', ..., '2026-04-30T21:00:00.000000000', '2026-04-30T22:00:00.000000000', '2026-04-30T23:00:00.000000000'], shape=(756768,), dtype='datetime64[ns]') - latitude()float6452.5
- long_name :
- latitude
- standard_name :
- latitude
- stored_direction :
- decreasing
- units :
- degrees_north
array(52.5)
- longitude()float6413.5
- long_name :
- longitude
- standard_name :
- longitude
- units :
- degrees_east
array(13.5)
- number()int64...
- long_name :
- ensemble member numerical id
- standard_name :
- realization
- units :
- 1
[1 values with dtype=int64]
- surface()float64...
- long_name :
- original GRIB coordinate for key: level(surface)
- units :
- 1
[1 values with dtype=float64]
- GRIB_NV :
- 0
- GRIB_Nx :
- 1440
- GRIB_Ny :
- 721
- GRIB_cfName :
- unknown
- GRIB_cfVarName :
- t2m
- GRIB_dataType :
- an
- GRIB_gridDefinitionDescription :
- Latitude/Longitude Grid
- GRIB_gridType :
- regular_ll
- GRIB_iDirectionIncrementInDegrees :
- 0.25
- GRIB_iScansNegatively :
- 0
- GRIB_jDirectionIncrementInDegrees :
- 0.25
- GRIB_jPointsAreConsecutive :
- 0
- GRIB_jScansPositively :
- 0
- GRIB_latitudeOfFirstGridPointInDegrees :
- 90.0
- GRIB_latitudeOfLastGridPointInDegrees :
- -90.0
- GRIB_longitudeOfFirstGridPointInDegrees :
- 0.0
- GRIB_longitudeOfLastGridPointInDegrees :
- 359.75
- GRIB_missingValue :
- 3.4028234663852886e+38
- GRIB_name :
- 2 metre temperature
- GRIB_numberOfPoints :
- 1038240
- GRIB_paramId :
- 167
- GRIB_shortName :
- 2t
- GRIB_stepType :
- instant
- GRIB_stepUnits :
- 1
- GRIB_totalNumber :
- 0
- GRIB_typeOfLevel :
- surface
- GRIB_units :
- K
- GRIB_uvRelativeToGrid :
- 0
- long_name :
- 2 metre temperature
- standard_name :
- unknown
- units :
- K
[ ]:
costing.estimate_download_size(t2m_Berlin)
Estimated download size: 2.32 GiB (2,376.0 MiB)
This is already small enough to be computed:
[ ]:
%%time

t2m_Berlin_computed = t2m_Berlin.compute()
CPU times: user 34.7 s, sys: 17.8 s, total: 52.4 s
Wall time: 49 s
Now that the data is loaded in memory we can easily compute the climatology for the reference period 1991-2020:
[ ]:
t2m_Berlin_climatology_mean = t2m_Berlin_computed.sel(valid_time=slice("1991", "2020")).groupby("valid_time.month").mean(dim="valid_time")
t2m_Berlin_climatology_std = t2m_Berlin_computed.sel(valid_time=slice("1991", "2020")).groupby("valid_time.month").std(dim="valid_time")
We also compute the monthly means for the year 2023:
[ ]:
t2m_Berlin_2023_monthly_means = t2m_Berlin_computed.sel(valid_time="2023").resample(valid_time="1ME").mean(dim="valid_time")
t2m_Berlin_2023_monthly_means
<xarray.DataArray 't2m' (valid_time: 12)> Size: 48B
array([277.32965, 276.1607 , 278.7016 , 281.0118 , 286.95126, 292.21667,
       293.0104 , 292.456  , 291.6545 , 285.081  , 278.75903, 276.78964],
      dtype=float32)
Coordinates:
  * valid_time  (valid_time) datetime64[ns] 96B 2023-01-31 ... 2023-12-31
    latitude    float64 8B 52.5
    longitude   float64 8B 13.5
    number      int64 8B 0
    surface     float64 8B 0.0
Attributes: (12/31)
    GRIB_NV:                                  0
    GRIB_Nx:                                  1440
    GRIB_Ny:                                  721
    GRIB_cfName:                              unknown
    GRIB_cfVarName:                           t2m
    GRIB_dataType:                            an
    ...                                       ...
    GRIB_typeOfLevel:                         surface
    GRIB_units:                               K
    GRIB_uvRelativeToGrid:                    0
    long_name:                                2 metre temperature
    standard_name:                            unknown
units: K- valid_time: 12
- 277.3 276.2 278.7 281.0 287.0 292.2 ... 292.5 291.7 285.1 278.8 276.8
array([277.32965, 276.1607 , 278.7016 , 281.0118 , 286.95126, 292.21667, 293.0104 , 292.456 , 291.6545 , 285.081 , 278.75903, 276.78964], dtype=float32) - valid_time(valid_time)datetime64[ns]2023-01-31 ... 2023-12-31
array(['2023-01-31T00:00:00.000000000', '2023-02-28T00:00:00.000000000', '2023-03-31T00:00:00.000000000', '2023-04-30T00:00:00.000000000', '2023-05-31T00:00:00.000000000', '2023-06-30T00:00:00.000000000', '2023-07-31T00:00:00.000000000', '2023-08-31T00:00:00.000000000', '2023-09-30T00:00:00.000000000', '2023-10-31T00:00:00.000000000', '2023-11-30T00:00:00.000000000', '2023-12-31T00:00:00.000000000'], dtype='datetime64[ns]') - latitude()float6452.5
- long_name :
- latitude
- standard_name :
- latitude
- stored_direction :
- decreasing
- units :
- degrees_north
array(52.5)
- longitude()float6413.5
- long_name :
- longitude
- standard_name :
- longitude
- units :
- degrees_east
array(13.5)
- number()int640
- long_name :
- ensemble member numerical id
- standard_name :
- realization
- units :
- 1
array(0)
- surface()float640.0
- long_name :
- original GRIB coordinate for key: level(surface)
- units :
- 1
array(0.)
- GRIB_NV :
- 0
- GRIB_Nx :
- 1440
- GRIB_Ny :
- 721
- GRIB_cfName :
- unknown
- GRIB_cfVarName :
- t2m
- GRIB_dataType :
- an
- GRIB_gridDefinitionDescription :
- Latitude/Longitude Grid
- GRIB_gridType :
- regular_ll
- GRIB_iDirectionIncrementInDegrees :
- 0.25
- GRIB_iScansNegatively :
- 0
- GRIB_jDirectionIncrementInDegrees :
- 0.25
- GRIB_jPointsAreConsecutive :
- 0
- GRIB_jScansPositively :
- 0
- GRIB_latitudeOfFirstGridPointInDegrees :
- 90.0
- GRIB_latitudeOfLastGridPointInDegrees :
- -90.0
- GRIB_longitudeOfFirstGridPointInDegrees :
- 0.0
- GRIB_longitudeOfLastGridPointInDegrees :
- 359.75
- GRIB_missingValue :
- 3.4028234663852886e+38
- GRIB_name :
- 2 metre temperature
- GRIB_numberOfPoints :
- 1038240
- GRIB_paramId :
- 167
- GRIB_shortName :
- 2t
- GRIB_stepType :
- instant
- GRIB_stepUnits :
- 1
- GRIB_totalNumber :
- 0
- GRIB_typeOfLevel :
- surface
- GRIB_units :
- K
- GRIB_uvRelativeToGrid :
- 0
- long_name :
- 2 metre temperature
- standard_name :
- unknown
- units :
- K
We can finally plot the climatology in Berlin for the 1991-2020 reference period against the 2023 monthly means:
[ ]:
plt.figure(figsize=(10, 5))
t2m_Berlin_climatology_mean.plot(label="Mean", color="#3498db")
plt.errorbar(
    t2m_Berlin_climatology_mean.month,
    t2m_Berlin_climatology_mean,
    yerr=t2m_Berlin_climatology_std,
    fmt="o",
    label="Standard Deviation",
    color="#a9a9a9"
)
for month in range (1, 11):
    t2m_point = t2m_Berlin_2023_monthly_means.sel(valid_time=t2m_Berlin_2023_monthly_means["valid_time.month"]==month)
    label = None
    if month == 1:
        label = "2023"
    plt.scatter(month, t2m_point, color="#ff6600", label=label)
plt.title("Surface Temperature climatology in Berlin (DE), 1991-2020")
plt.xticks(t2m_Berlin_climatology_mean.month)
plt.xlabel("Month")
plt.ylabel("Surface Temperature [°C]")
plt.legend()
plt.grid(alpha=0.3)
plt.show()