How to work with ERA5-Land on Earth Data Hub: storm Daniel flood, Greece 2023#
Earth Data Hub (EDH) offers an innovative and super-efficient way to access earth related data. This notebook will provide you guidance on how to access and use the ERA5-Land dataset on Earth Data Hub.
Goal of this tutorial#
The first goal of this tutorial is to compute the total precipitation observed during the Storm Daniel event, from 6 to 7 September 2023, in Greece, and compare it with the average 1993-2022 precipitation in the same area.
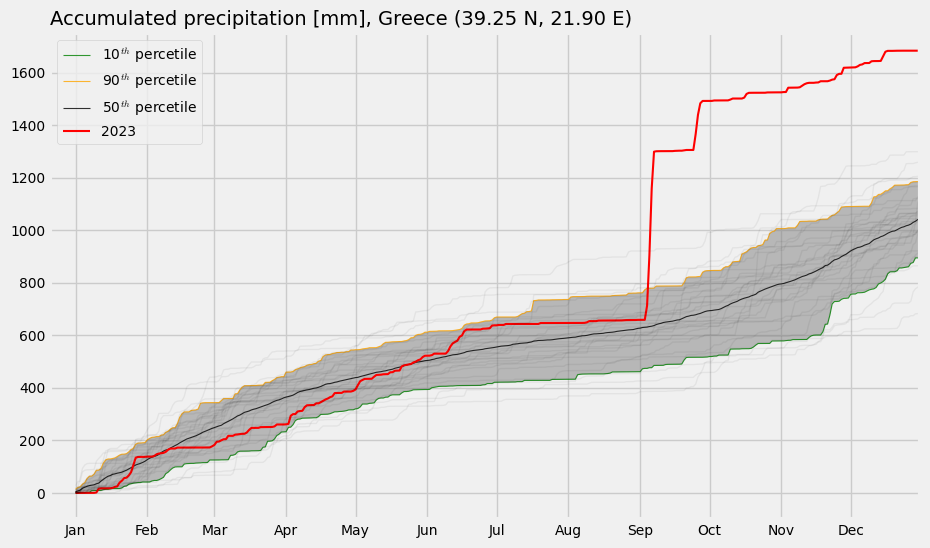
The second goal of this tutorial is to compare the 2023 cumulative precipitation on a specific interland location (39.25 N, 21.9 E) with the cumulative 1993-2022 precipitation in the same location.
What you will learn:#
how to access the dataset
select and reduce the data
plot the results
To access datasets on Earth Data Hub you need to instruct your tools (xarray, Zarr, etc.) to use EDH personal access token when downloading the data.
To obtain a personal access token you first need to register to the Destination Earth platform. Then you can go to Earth Data Hub account settings where you can find your default personal access token or create others. After retrieving your personal access token, please cut and paste it below: ⤵
[ ]:
PAT = "your_EDH_personal_access_token"

#e.g. PAT="edh_pat_44bbb7e9192a4c6bb47ddf07d07564eee5d17de8dfc48f7118f88e3bc4a4157f8fe2403f5aa0a2d53441b6922ea9a33a"
Working with EDH data#
Datasets on Earth Data Hub are often very large and remotely hosted. Typical use imply a selection of the data followed by one or more reduction steps to be performed in a local or distributed Dask environment.
The structure of a workflow that uses EDH data typically looks like this:
Data access
Data selection
Data reduction (optional)
Data download
Further operations and visualisation
Xarray and Dask work together following a lazy principle. This means that when you access and manipulate a Zarr store the data is in not immediately downloaded and loaded in memory. Instead, Dask constructs a task graph that represents the operations to be performed. A smart user will first reduce the amount of data that needs to be downloaded and explicitly call compute() on it. Once the compute() operation is complete
the data is loaded into memory and available for subsequent fast processing.
1. Data access#
To access the data, only the dataset metadata must be downloaded. Xarray does this automatically when you access a Zarr dataset:
[ ]:
import xarray as xr

ds = xr.open_dataset(
    f"https://edh:{PAT}@data.earthdatahub.destine.eu/era5/reanalysis-era5-land-no-antartica-v0.zarr",
    chunks={},
    engine="zarr",
)
ds
<xarray.Dataset> Size: 709TB
Dimensions:              (valid_time: 669096, latitude: 1472, longitude: 3600)
Coordinates:
  * valid_time           (valid_time) datetime64[ns] 5MB 1950-01-01 ... 2026-...
  * latitude             (latitude) float64 12kB 90.0 89.9 89.8 ... -57.0 -57.1
  * longitude            (longitude) float64 29kB 0.0 0.1 0.2 ... 359.8 359.9
    depthBelowLandLayer  float64 8B ...
    number               int64 8B ...
    surface              float64 8B ...
Data variables: (12/50)
    asn                  (valid_time, latitude, longitude) float32 14TB dask.array<chunksize=(2880, 64, 64), meta=np.ndarray>
    d2m                  (valid_time, latitude, longitude) float32 14TB dask.array<chunksize=(2880, 64, 64), meta=np.ndarray>
    e                    (valid_time, latitude, longitude) float32 14TB dask.array<chunksize=(2880, 64, 64), meta=np.ndarray>
    es                   (valid_time, latitude, longitude) float32 14TB dask.array<chunksize=(2880, 64, 64), meta=np.ndarray>
    evabs                (valid_time, latitude, longitude) float32 14TB dask.array<chunksize=(2880, 64, 64), meta=np.ndarray>
    evaow                (valid_time, latitude, longitude) float32 14TB dask.array<chunksize=(2880, 64, 64), meta=np.ndarray>
    ...                   ...
    swvl4                (valid_time, latitude, longitude) float32 14TB dask.array<chunksize=(2880, 64, 64), meta=np.ndarray>
    t2m                  (valid_time, latitude, longitude) float32 14TB dask.array<chunksize=(2880, 64, 64), meta=np.ndarray>
    tp                   (valid_time, latitude, longitude) float32 14TB dask.array<chunksize=(2880, 64, 64), meta=np.ndarray>
    tsn                  (valid_time, latitude, longitude) float32 14TB dask.array<chunksize=(2880, 64, 64), meta=np.ndarray>
    u10                  (valid_time, latitude, longitude) float32 14TB dask.array<chunksize=(2880, 64, 64), meta=np.ndarray>
    v10                  (valid_time, latitude, longitude) float32 14TB dask.array<chunksize=(2880, 64, 64), meta=np.ndarray>
Attributes:
    Conventions:             CF-1.7
    GRIB_centre:             ecmf
    GRIB_centreDescription:  European Centre for Medium-Range Weather Forecasts
    GRIB_edition:            1
    GRIB_subCentre:          0
    history:                 2024-10-29T11:44 GRIB to CDM+CF via cfgrib-0.9.1...
institution: European Centre for Medium-Range Weather Forecasts- valid_time: 669096
- latitude: 1472
- longitude: 3600
- valid_time(valid_time)datetime64[ns]1950-01-01 ... 2026-04-30T23:00:00
array(['1950-01-01T00:00:00.000000000', '1950-01-01T01:00:00.000000000', '1950-01-01T02:00:00.000000000', ..., '2026-04-30T21:00:00.000000000', '2026-04-30T22:00:00.000000000', '2026-04-30T23:00:00.000000000'], shape=(669096,), dtype='datetime64[ns]') - latitude(latitude)float6490.0 89.9 89.8 ... -57.0 -57.1
- long_name :
- latitude
- standard_name :
- latitude
- stored_direction :
- decreasing
- units :
- degrees_north
array([ 90. , 89.9, 89.8, ..., -56.9, -57. , -57.1], shape=(1472,))
- longitude(longitude)float640.0 0.1 0.2 ... 359.7 359.8 359.9
- long_name :
- longitude
- standard_name :
- longitude
- units :
- degrees_east
array([0.000e+00, 1.000e-01, 2.000e-01, ..., 3.597e+02, 3.598e+02, 3.599e+02], shape=(3600,)) - depthBelowLandLayer()float64...
- long_name :
- soil depth
- positive :
- down
- standard_name :
- depth
- units :
- m
[1 values with dtype=float64]
- number()int64...
- long_name :
- ensemble member numerical id
- standard_name :
- realization
- units :
- 1
[1 values with dtype=int64]
- surface()float64...
- long_name :
- original GRIB coordinate for key: level(surface)
- units :
- 1
[1 values with dtype=float64]
- asn(valid_time, latitude, longitude)float32dask.array<chunksize=(2880, 64, 64), meta=np.ndarray>
- GRIB_NV :
- 0
- GRIB_Nx :
- 3600
- GRIB_Ny :
- 1472
- GRIB_cfName :
- unknown
- GRIB_cfVarName :
- asn
- GRIB_dataType :
- an
- GRIB_gridDefinitionDescription :
- Latitude/Longitude Grid
- GRIB_gridType :
- regular_ll
- GRIB_iDirectionIncrementInDegrees :
- 0.1
- GRIB_iScansNegatively :
- 0
- GRIB_jDirectionIncrementInDegrees :
- 0.1
- GRIB_jPointsAreConsecutive :
- 0
- GRIB_jScansPositively :
- 0
- GRIB_latitudeOfFirstGridPointInDegrees :
- 90.0
- GRIB_latitudeOfLastGridPointInDegrees :
- -57.1
- GRIB_longitudeOfFirstGridPointInDegrees :
- 0.0
- GRIB_longitudeOfLastGridPointInDegrees :
- 359.9
- GRIB_missingValue :
- 3.4028234663852886e+38
- GRIB_name :
- Snow albedo
- GRIB_numberOfPoints :
- 5299200
- GRIB_paramId :
- 32
- GRIB_shortName :
- asn
- GRIB_stepType :
- instant
- GRIB_stepUnits :
- 1
- GRIB_totalNumber :
- 0
- GRIB_typeOfLevel :
- surface
- GRIB_units :
- (0 - 1)
- long_name :
- Snow albedo
- standard_name :
- unknown
- units :
- (0 - 1)
Array Chunk Bytes 12.90 TiB 45.00 MiB Shape (669096, 1472, 3600) (2880, 64, 64) Dask graph 305463 chunks in 2 graph layers Data type float32 numpy.ndarray - d2m(valid_time, latitude, longitude)float32dask.array<chunksize=(2880, 64, 64), meta=np.ndarray>
- GRIB_NV :
- 0
- GRIB_Nx :
- 3600
- GRIB_Ny :
- 1472
- GRIB_cfName :
- unknown
- GRIB_cfVarName :
- d2m
- GRIB_dataType :
- fc
- GRIB_gridDefinitionDescription :
- Latitude/Longitude Grid
- GRIB_gridType :
- regular_ll
- GRIB_iDirectionIncrementInDegrees :
- 0.1
- GRIB_iScansNegatively :
- 0
- GRIB_jDirectionIncrementInDegrees :
- 0.1
- GRIB_jPointsAreConsecutive :
- 0
- GRIB_jScansPositively :
- 0
- GRIB_latitudeOfFirstGridPointInDegrees :
- 90.0
- GRIB_latitudeOfLastGridPointInDegrees :
- -57.1
- GRIB_longitudeOfFirstGridPointInDegrees :
- 0.0
- GRIB_longitudeOfLastGridPointInDegrees :
- 359.9
- GRIB_missingValue :
- 3.4028234663852886e+38
- GRIB_name :
- 2 metre dewpoint temperature
- GRIB_numberOfPoints :
- 5299200
- GRIB_paramId :
- 168
- GRIB_shortName :
- 2d
- GRIB_stepType :
- instant
- GRIB_stepUnits :
- 1
- GRIB_totalNumber :
- 0
- GRIB_typeOfLevel :
- surface
- GRIB_units :
- K
- long_name :
- 2 metre dewpoint temperature
- standard_name :
- unknown
- units :
- K
Array Chunk Bytes 12.90 TiB 45.00 MiB Shape (669096, 1472, 3600) (2880, 64, 64) Dask graph 305463 chunks in 2 graph layers Data type float32 numpy.ndarray - e(valid_time, latitude, longitude)float32dask.array<chunksize=(2880, 64, 64), meta=np.ndarray>
- GRIB_NV :
- 0
- GRIB_Nx :
- 3600
- GRIB_Ny :
- 1472
- GRIB_cfName :
- lwe_thickness_of_water_evaporation_amount
- GRIB_cfVarName :
- e
- GRIB_dataType :
- fc
- GRIB_gridDefinitionDescription :
- Latitude/Longitude Grid
- GRIB_gridType :
- regular_ll
- GRIB_iDirectionIncrementInDegrees :
- 0.1
- GRIB_iScansNegatively :
- 0
- GRIB_jDirectionIncrementInDegrees :
- 0.1
- GRIB_jPointsAreConsecutive :
- 0
- GRIB_jScansPositively :
- 0
- GRIB_latitudeOfFirstGridPointInDegrees :
- 90.0
- GRIB_latitudeOfLastGridPointInDegrees :
- -57.1
- GRIB_longitudeOfFirstGridPointInDegrees :
- 0.0
- GRIB_longitudeOfLastGridPointInDegrees :
- 359.9
- GRIB_missingValue :
- 3.4028234663852886e+38
- GRIB_name :
- Evaporation
- GRIB_numberOfPoints :
- 5299200
- GRIB_paramId :
- 182
- GRIB_shortName :
- e
- GRIB_stepType :
- accum
- GRIB_stepUnits :
- 1
- GRIB_totalNumber :
- 0
- GRIB_typeOfLevel :
- surface
- GRIB_units :
- m of water equivalent
- long_name :
- Evaporation
- standard_name :
- lwe_thickness_of_water_evaporation_amount
- units :
- m of water equivalent
Array Chunk Bytes 12.90 TiB 45.00 MiB Shape (669096, 1472, 3600) (2880, 64, 64) Dask graph 305463 chunks in 2 graph layers Data type float32 numpy.ndarray - es(valid_time, latitude, longitude)float32dask.array<chunksize=(2880, 64, 64), meta=np.ndarray>
- GRIB_NV :
- 0
- GRIB_Nx :
- 3600
- GRIB_Ny :
- 1472
- GRIB_cfName :
- unknown
- GRIB_cfVarName :
- es
- GRIB_dataType :
- fc
- GRIB_gridDefinitionDescription :
- Latitude/Longitude Grid
- GRIB_gridType :
- regular_ll
- GRIB_iDirectionIncrementInDegrees :
- 0.1
- GRIB_iScansNegatively :
- 0
- GRIB_jDirectionIncrementInDegrees :
- 0.1
- GRIB_jPointsAreConsecutive :
- 0
- GRIB_jScansPositively :
- 0
- GRIB_latitudeOfFirstGridPointInDegrees :
- 90.0
- GRIB_latitudeOfLastGridPointInDegrees :
- -57.1
- GRIB_longitudeOfFirstGridPointInDegrees :
- 0.0
- GRIB_longitudeOfLastGridPointInDegrees :
- 359.9
- GRIB_missingValue :
- 3.4028234663852886e+38
- GRIB_name :
- Snow evaporation
- GRIB_numberOfPoints :
- 5299200
- GRIB_paramId :
- 44
- GRIB_shortName :
- es
- GRIB_stepType :
- accum
- GRIB_stepUnits :
- 1
- GRIB_totalNumber :
- 0
- GRIB_typeOfLevel :
- surface
- GRIB_units :
- m of water equivalent
- long_name :
- Snow evaporation
- standard_name :
- unknown
- units :
- m of water equivalent
Array Chunk Bytes 12.90 TiB 45.00 MiB Shape (669096, 1472, 3600) (2880, 64, 64) Dask graph 305463 chunks in 2 graph layers Data type float32 numpy.ndarray - evabs(valid_time, latitude, longitude)float32dask.array<chunksize=(2880, 64, 64), meta=np.ndarray>
- GRIB_NV :
- 0
- GRIB_Nx :
- 3600
- GRIB_Ny :
- 1472
- GRIB_cfName :
- unknown
- GRIB_cfVarName :
- evabs
- GRIB_dataType :
- fc
- GRIB_gridDefinitionDescription :
- Latitude/longitude
- GRIB_gridType :
- regular_ll
- GRIB_iDirectionIncrementInDegrees :
- 0.1
- GRIB_iScansNegatively :
- 0
- GRIB_jDirectionIncrementInDegrees :
- 0.1
- GRIB_jPointsAreConsecutive :
- 0
- GRIB_jScansPositively :
- 0
- GRIB_latitudeOfFirstGridPointInDegrees :
- 90.0
- GRIB_latitudeOfLastGridPointInDegrees :
- -57.1
- GRIB_longitudeOfFirstGridPointInDegrees :
- 0.0
- GRIB_longitudeOfLastGridPointInDegrees :
- 359.9
- GRIB_missingValue :
- 3.4028234663852886e+38
- GRIB_name :
- Evaporation from bare soil
- GRIB_numberOfPoints :
- 5299200
- GRIB_paramId :
- 228101
- GRIB_shortName :
- evabs
- GRIB_stepType :
- accum
- GRIB_stepUnits :
- 1
- GRIB_typeOfLevel :
- surface
- GRIB_units :
- m of water equivalent
- long_name :
- Evaporation from bare soil
- standard_name :
- unknown
- units :
- m of water equivalent
Array Chunk Bytes 12.90 TiB 45.00 MiB Shape (669096, 1472, 3600) (2880, 64, 64) Dask graph 305463 chunks in 2 graph layers Data type float32 numpy.ndarray - evaow(valid_time, latitude, longitude)float32dask.array<chunksize=(2880, 64, 64), meta=np.ndarray>
- GRIB_NV :
- 0
- GRIB_Nx :
- 3600
- GRIB_Ny :
- 1472
- GRIB_cfName :
- unknown
- GRIB_cfVarName :
- evaow
- GRIB_dataType :
- fc
- GRIB_gridDefinitionDescription :
- Latitude/longitude
- GRIB_gridType :
- regular_ll
- GRIB_iDirectionIncrementInDegrees :
- 0.1
- GRIB_iScansNegatively :
- 0
- GRIB_jDirectionIncrementInDegrees :
- 0.1
- GRIB_jPointsAreConsecutive :
- 0
- GRIB_jScansPositively :
- 0
- GRIB_latitudeOfFirstGridPointInDegrees :
- 90.0
- GRIB_latitudeOfLastGridPointInDegrees :
- -57.1
- GRIB_longitudeOfFirstGridPointInDegrees :
- 0.0
- GRIB_longitudeOfLastGridPointInDegrees :
- 359.9
- GRIB_missingValue :
- 3.4028234663852886e+38
- GRIB_name :
- Evaporation from open water surfaces excluding oceans
- GRIB_numberOfPoints :
- 5299200
- GRIB_paramId :
- 228102
- GRIB_shortName :
- evaow
- GRIB_stepType :
- accum
- GRIB_stepUnits :
- 1
- GRIB_typeOfLevel :
- surface
- GRIB_units :
- m of water equivalent
- long_name :
- Evaporation from open water surfaces excluding oceans
- standard_name :
- unknown
- units :
- m of water equivalent
Array Chunk Bytes 12.90 TiB 45.00 MiB Shape (669096, 1472, 3600) (2880, 64, 64) Dask graph 305463 chunks in 2 graph layers Data type float32 numpy.ndarray - evatc(valid_time, latitude, longitude)float32dask.array<chunksize=(2880, 64, 64), meta=np.ndarray>
- GRIB_NV :
- 0
- GRIB_Nx :
- 3600
- GRIB_Ny :
- 1472
- GRIB_cfName :
- unknown
- GRIB_cfVarName :
- evatc
- GRIB_dataType :
- fc
- GRIB_gridDefinitionDescription :
- Latitude/longitude
- GRIB_gridType :
- regular_ll
- GRIB_iDirectionIncrementInDegrees :
- 0.1
- GRIB_iScansNegatively :
- 0
- GRIB_jDirectionIncrementInDegrees :
- 0.1
- GRIB_jPointsAreConsecutive :
- 0
- GRIB_jScansPositively :
- 0
- GRIB_latitudeOfFirstGridPointInDegrees :
- 90.0
- GRIB_latitudeOfLastGridPointInDegrees :
- -57.1
- GRIB_longitudeOfFirstGridPointInDegrees :
- 0.0
- GRIB_longitudeOfLastGridPointInDegrees :
- 359.9
- GRIB_missingValue :
- 3.4028234663852886e+38
- GRIB_name :
- Evaporation from the top of canopy
- GRIB_numberOfPoints :
- 5299200
- GRIB_paramId :
- 228100
- GRIB_shortName :
- evatc
- GRIB_stepType :
- accum
- GRIB_stepUnits :
- 1
- GRIB_typeOfLevel :
- surface
- GRIB_units :
- m of water equivalent
- long_name :
- Evaporation from the top of canopy
- standard_name :
- unknown
- units :
- m of water equivalent
Array Chunk Bytes 12.90 TiB 45.00 MiB Shape (669096, 1472, 3600) (2880, 64, 64) Dask graph 305463 chunks in 2 graph layers Data type float32 numpy.ndarray - evavt(valid_time, latitude, longitude)float32dask.array<chunksize=(2880, 64, 64), meta=np.ndarray>
- GRIB_NV :
- 0
- GRIB_Nx :
- 3600
- GRIB_Ny :
- 1472
- GRIB_cfName :
- unknown
- GRIB_cfVarName :
- evavt
- GRIB_dataType :
- fc
- GRIB_gridDefinitionDescription :
- Latitude/longitude
- GRIB_gridType :
- regular_ll
- GRIB_iDirectionIncrementInDegrees :
- 0.1
- GRIB_iScansNegatively :
- 0
- GRIB_jDirectionIncrementInDegrees :
- 0.1
- GRIB_jPointsAreConsecutive :
- 0
- GRIB_jScansPositively :
- 0
- GRIB_latitudeOfFirstGridPointInDegrees :
- 90.0
- GRIB_latitudeOfLastGridPointInDegrees :
- -57.1
- GRIB_longitudeOfFirstGridPointInDegrees :
- 0.0
- GRIB_longitudeOfLastGridPointInDegrees :
- 359.9
- GRIB_missingValue :
- 3.4028234663852886e+38
- GRIB_name :
- Evaporation from vegetation transpiration
- GRIB_numberOfPoints :
- 5299200
- GRIB_paramId :
- 228103
- GRIB_shortName :
- evavt
- GRIB_stepType :
- accum
- GRIB_stepUnits :
- 1
- GRIB_typeOfLevel :
- surface
- GRIB_units :
- m of water equivalent
- long_name :
- Evaporation from vegetation transpiration
- standard_name :
- unknown
- units :
- m of water equivalent
Array Chunk Bytes 12.90 TiB 45.00 MiB Shape (669096, 1472, 3600) (2880, 64, 64) Dask graph 305463 chunks in 2 graph layers Data type float32 numpy.ndarray - fal(valid_time, latitude, longitude)float32dask.array<chunksize=(2880, 64, 64), meta=np.ndarray>
- GRIB_NV :
- 0
- GRIB_Nx :
- 3600
- GRIB_Ny :
- 1472
- GRIB_cfName :
- unknown
- GRIB_cfVarName :
- fal
- GRIB_dataType :
- fc
- GRIB_gridDefinitionDescription :
- Latitude/Longitude Grid
- GRIB_gridType :
- regular_ll
- GRIB_iDirectionIncrementInDegrees :
- 0.1
- GRIB_iScansNegatively :
- 0
- GRIB_jDirectionIncrementInDegrees :
- 0.1
- GRIB_jPointsAreConsecutive :
- 0
- GRIB_jScansPositively :
- 0
- GRIB_latitudeOfFirstGridPointInDegrees :
- 90.0
- GRIB_latitudeOfLastGridPointInDegrees :
- -57.1
- GRIB_longitudeOfFirstGridPointInDegrees :
- 0.0
- GRIB_longitudeOfLastGridPointInDegrees :
- 359.9
- GRIB_missingValue :
- 3.4028234663852886e+38
- GRIB_name :
- Forecast albedo
- GRIB_numberOfPoints :
- 5299200
- GRIB_paramId :
- 243
- GRIB_shortName :
- fal
- GRIB_stepType :
- instant
- GRIB_stepUnits :
- 1
- GRIB_totalNumber :
- 0
- GRIB_typeOfLevel :
- surface
- GRIB_units :
- (0 - 1)
- long_name :
- Forecast albedo
- standard_name :
- unknown
- units :
- (0 - 1)
Array Chunk Bytes 12.90 TiB 45.00 MiB Shape (669096, 1472, 3600) (2880, 64, 64) Dask graph 305463 chunks in 2 graph layers Data type float32 numpy.ndarray - lai_hv(valid_time, latitude, longitude)float32dask.array<chunksize=(2880, 64, 64), meta=np.ndarray>
- GRIB_NV :
- 0
- GRIB_Nx :
- 3600
- GRIB_Ny :
- 1472
- GRIB_cfName :
- unknown
- GRIB_cfVarName :
- lai_hv
- GRIB_dataType :
- fc
- GRIB_gridDefinitionDescription :
- Latitude/Longitude Grid
- GRIB_gridType :
- regular_ll
- GRIB_iDirectionIncrementInDegrees :
- 0.1
- GRIB_iScansNegatively :
- 0
- GRIB_jDirectionIncrementInDegrees :
- 0.1
- GRIB_jPointsAreConsecutive :
- 0
- GRIB_jScansPositively :
- 0
- GRIB_latitudeOfFirstGridPointInDegrees :
- 90.0
- GRIB_latitudeOfLastGridPointInDegrees :
- -57.1
- GRIB_longitudeOfFirstGridPointInDegrees :
- 0.0
- GRIB_longitudeOfLastGridPointInDegrees :
- 359.9
- GRIB_missingValue :
- 3.4028234663852886e+38
- GRIB_name :
- Leaf area index, high vegetation
- GRIB_numberOfPoints :
- 5299200
- GRIB_paramId :
- 67
- GRIB_shortName :
- lai_hv
- GRIB_stepType :
- instant
- GRIB_stepUnits :
- 1
- GRIB_totalNumber :
- 0
- GRIB_typeOfLevel :
- surface
- GRIB_units :
- m**2 m**-2
- long_name :
- Leaf area index, high vegetation
- standard_name :
- unknown
- units :
- m**2 m**-2
Array Chunk Bytes 12.90 TiB 45.00 MiB Shape (669096, 1472, 3600) (2880, 64, 64) Dask graph 305463 chunks in 2 graph layers Data type float32 numpy.ndarray - lai_lv(valid_time, latitude, longitude)float32dask.array<chunksize=(2880, 64, 64), meta=np.ndarray>
- GRIB_NV :
- 0
- GRIB_Nx :
- 3600
- GRIB_Ny :
- 1472
- GRIB_cfName :
- unknown
- GRIB_cfVarName :
- lai_lv
- GRIB_dataType :
- fc
- GRIB_gridDefinitionDescription :
- Latitude/Longitude Grid
- GRIB_gridType :
- regular_ll
- GRIB_iDirectionIncrementInDegrees :
- 0.1
- GRIB_iScansNegatively :
- 0
- GRIB_jDirectionIncrementInDegrees :
- 0.1
- GRIB_jPointsAreConsecutive :
- 0
- GRIB_jScansPositively :
- 0
- GRIB_latitudeOfFirstGridPointInDegrees :
- 90.0
- GRIB_latitudeOfLastGridPointInDegrees :
- -57.1
- GRIB_longitudeOfFirstGridPointInDegrees :
- 0.0
- GRIB_longitudeOfLastGridPointInDegrees :
- 359.9
- GRIB_missingValue :
- 3.4028234663852886e+38
- GRIB_name :
- Leaf area index, low vegetation
- GRIB_numberOfPoints :
- 5299200
- GRIB_paramId :
- 66
- GRIB_shortName :
- lai_lv
- GRIB_stepType :
- instant
- GRIB_stepUnits :
- 1
- GRIB_totalNumber :
- 0
- GRIB_typeOfLevel :
- surface
- GRIB_units :
- m**2 m**-2
- long_name :
- Leaf area index, low vegetation
- standard_name :
- unknown
- units :
- m**2 m**-2
Array Chunk Bytes 12.90 TiB 45.00 MiB Shape (669096, 1472, 3600) (2880, 64, 64) Dask graph 305463 chunks in 2 graph layers Data type float32 numpy.ndarray - lblt(valid_time, latitude, longitude)float32dask.array<chunksize=(2880, 64, 64), meta=np.ndarray>
- GRIB_NV :
- 0
- GRIB_Nx :
- 3600
- GRIB_Ny :
- 1472
- GRIB_cfName :
- unknown
- GRIB_cfVarName :
- lblt
- GRIB_dataType :
- an
- GRIB_gridDefinitionDescription :
- Latitude/Longitude Grid
- GRIB_gridType :
- regular_ll
- GRIB_iDirectionIncrementInDegrees :
- 0.1
- GRIB_iScansNegatively :
- 0
- GRIB_jDirectionIncrementInDegrees :
- 0.1
- GRIB_jPointsAreConsecutive :
- 0
- GRIB_jScansPositively :
- 0
- GRIB_latitudeOfFirstGridPointInDegrees :
- 90.0
- GRIB_latitudeOfLastGridPointInDegrees :
- -57.1
- GRIB_longitudeOfFirstGridPointInDegrees :
- 0.0
- GRIB_longitudeOfLastGridPointInDegrees :
- 359.9
- GRIB_missingValue :
- 3.4028234663852886e+38
- GRIB_name :
- Lake bottom temperature
- GRIB_numberOfPoints :
- 5299200
- GRIB_paramId :
- 228010
- GRIB_shortName :
- lblt
- GRIB_stepType :
- instant
- GRIB_stepUnits :
- 1
- GRIB_totalNumber :
- 0
- GRIB_typeOfLevel :
- surface
- GRIB_units :
- K
- long_name :
- Lake bottom temperature
- standard_name :
- unknown
- units :
- K
Array Chunk Bytes 12.90 TiB 45.00 MiB Shape (669096, 1472, 3600) (2880, 64, 64) Dask graph 305463 chunks in 2 graph layers Data type float32 numpy.ndarray - licd(valid_time, latitude, longitude)float32dask.array<chunksize=(2880, 64, 64), meta=np.ndarray>
- GRIB_NV :
- 0
- GRIB_Nx :
- 3600
- GRIB_Ny :
- 1472
- GRIB_cfName :
- unknown
- GRIB_cfVarName :
- licd
- GRIB_dataType :
- an
- GRIB_gridDefinitionDescription :
- Latitude/Longitude Grid
- GRIB_gridType :
- regular_ll
- GRIB_iDirectionIncrementInDegrees :
- 0.1
- GRIB_iScansNegatively :
- 0
- GRIB_jDirectionIncrementInDegrees :
- 0.1
- GRIB_jPointsAreConsecutive :
- 0
- GRIB_jScansPositively :
- 0
- GRIB_latitudeOfFirstGridPointInDegrees :
- 90.0
- GRIB_latitudeOfLastGridPointInDegrees :
- -57.1
- GRIB_longitudeOfFirstGridPointInDegrees :
- 0.0
- GRIB_longitudeOfLastGridPointInDegrees :
- 359.9
- GRIB_missingValue :
- 3.4028234663852886e+38
- GRIB_name :
- Lake ice total depth
- GRIB_numberOfPoints :
- 5299200
- GRIB_paramId :
- 228014
- GRIB_shortName :
- licd
- GRIB_stepType :
- instant
- GRIB_stepUnits :
- 1
- GRIB_totalNumber :
- 0
- GRIB_typeOfLevel :
- surface
- GRIB_units :
- m
- long_name :
- Lake ice total depth
- standard_name :
- unknown
- units :
- m
Array Chunk Bytes 12.90 TiB 45.00 MiB Shape (669096, 1472, 3600) (2880, 64, 64) Dask graph 305463 chunks in 2 graph layers Data type float32 numpy.ndarray - lict(valid_time, latitude, longitude)float32dask.array<chunksize=(2880, 64, 64), meta=np.ndarray>
- GRIB_NV :
- 0
- GRIB_Nx :
- 3600
- GRIB_Ny :
- 1472
- GRIB_cfName :
- unknown
- GRIB_cfVarName :
- lict
- GRIB_dataType :
- an
- GRIB_gridDefinitionDescription :
- Latitude/Longitude Grid
- GRIB_gridType :
- regular_ll
- GRIB_iDirectionIncrementInDegrees :
- 0.1
- GRIB_iScansNegatively :
- 0
- GRIB_jDirectionIncrementInDegrees :
- 0.1
- GRIB_jPointsAreConsecutive :
- 0
- GRIB_jScansPositively :
- 0
- GRIB_latitudeOfFirstGridPointInDegrees :
- 90.0
- GRIB_latitudeOfLastGridPointInDegrees :
- -57.1
- GRIB_longitudeOfFirstGridPointInDegrees :
- 0.0
- GRIB_longitudeOfLastGridPointInDegrees :
- 359.9
- GRIB_missingValue :
- 3.4028234663852886e+38
- GRIB_name :
- Lake ice surface temperature
- GRIB_numberOfPoints :
- 5299200
- GRIB_paramId :
- 228013
- GRIB_shortName :
- lict
- GRIB_stepType :
- instant
- GRIB_stepUnits :
- 1
- GRIB_totalNumber :
- 0
- GRIB_typeOfLevel :
- surface
- GRIB_units :
- K
- long_name :
- Lake ice surface temperature
- standard_name :
- unknown
- units :
- K
Array Chunk Bytes 12.90 TiB 45.00 MiB Shape (669096, 1472, 3600) (2880, 64, 64) Dask graph 305463 chunks in 2 graph layers Data type float32 numpy.ndarray - lmld(valid_time, latitude, longitude)float32dask.array<chunksize=(2880, 64, 64), meta=np.ndarray>
- GRIB_NV :
- 0
- GRIB_Nx :
- 3600
- GRIB_Ny :
- 1472
- GRIB_cfName :
- unknown
- GRIB_cfVarName :
- lmld
- GRIB_dataType :
- an
- GRIB_gridDefinitionDescription :
- Latitude/Longitude Grid
- GRIB_gridType :
- regular_ll
- GRIB_iDirectionIncrementInDegrees :
- 0.1
- GRIB_iScansNegatively :
- 0
- GRIB_jDirectionIncrementInDegrees :
- 0.1
- GRIB_jPointsAreConsecutive :
- 0
- GRIB_jScansPositively :
- 0
- GRIB_latitudeOfFirstGridPointInDegrees :
- 90.0
- GRIB_latitudeOfLastGridPointInDegrees :
- -57.1
- GRIB_longitudeOfFirstGridPointInDegrees :
- 0.0
- GRIB_longitudeOfLastGridPointInDegrees :
- 359.9
- GRIB_missingValue :
- 3.4028234663852886e+38
- GRIB_name :
- Lake mix-layer depth
- GRIB_numberOfPoints :
- 5299200
- GRIB_paramId :
- 228009
- GRIB_shortName :
- lmld
- GRIB_stepType :
- instant
- GRIB_stepUnits :
- 1
- GRIB_totalNumber :
- 0
- GRIB_typeOfLevel :
- surface
- GRIB_units :
- m
- long_name :
- Lake mix-layer depth
- standard_name :
- unknown
- units :
- m
Array Chunk Bytes 12.90 TiB 45.00 MiB Shape (669096, 1472, 3600) (2880, 64, 64) Dask graph 305463 chunks in 2 graph layers Data type float32 numpy.ndarray - lmlt(valid_time, latitude, longitude)float32dask.array<chunksize=(2880, 64, 64), meta=np.ndarray>
- GRIB_NV :
- 0
- GRIB_Nx :
- 3600
- GRIB_Ny :
- 1472
- GRIB_cfName :
- unknown
- GRIB_cfVarName :
- lmlt
- GRIB_dataType :
- an
- GRIB_gridDefinitionDescription :
- Latitude/Longitude Grid
- GRIB_gridType :
- regular_ll
- GRIB_iDirectionIncrementInDegrees :
- 0.1
- GRIB_iScansNegatively :
- 0
- GRIB_jDirectionIncrementInDegrees :
- 0.1
- GRIB_jPointsAreConsecutive :
- 0
- GRIB_jScansPositively :
- 0
- GRIB_latitudeOfFirstGridPointInDegrees :
- 90.0
- GRIB_latitudeOfLastGridPointInDegrees :
- -57.1
- GRIB_longitudeOfFirstGridPointInDegrees :
- 0.0
- GRIB_longitudeOfLastGridPointInDegrees :
- 359.9
- GRIB_missingValue :
- 3.4028234663852886e+38
- GRIB_name :
- Lake mix-layer temperature
- GRIB_numberOfPoints :
- 5299200
- GRIB_paramId :
- 228008
- GRIB_shortName :
- lmlt
- GRIB_stepType :
- instant
- GRIB_stepUnits :
- 1
- GRIB_totalNumber :
- 0
- GRIB_typeOfLevel :
- surface
- GRIB_units :
- K
- long_name :
- Lake mix-layer temperature
- standard_name :
- unknown
- units :
- K
Array Chunk Bytes 12.90 TiB 45.00 MiB Shape (669096, 1472, 3600) (2880, 64, 64) Dask graph 305463 chunks in 2 graph layers Data type float32 numpy.ndarray - lshf(valid_time, latitude, longitude)float32dask.array<chunksize=(2880, 64, 64), meta=np.ndarray>
- GRIB_NV :
- 0
- GRIB_Nx :
- 3600
- GRIB_Ny :
- 1472
- GRIB_cfName :
- unknown
- GRIB_cfVarName :
- lshf
- GRIB_dataType :
- an
- GRIB_gridDefinitionDescription :
- Latitude/Longitude Grid
- GRIB_gridType :
- regular_ll
- GRIB_iDirectionIncrementInDegrees :
- 0.1
- GRIB_iScansNegatively :
- 0
- GRIB_jDirectionIncrementInDegrees :
- 0.1
- GRIB_jPointsAreConsecutive :
- 0
- GRIB_jScansPositively :
- 0
- GRIB_latitudeOfFirstGridPointInDegrees :
- 90.0
- GRIB_latitudeOfLastGridPointInDegrees :
- -57.1
- GRIB_longitudeOfFirstGridPointInDegrees :
- 0.0
- GRIB_longitudeOfLastGridPointInDegrees :
- 359.9
- GRIB_missingValue :
- 3.4028234663852886e+38
- GRIB_name :
- Lake shape factor
- GRIB_numberOfPoints :
- 5299200
- GRIB_paramId :
- 228012
- GRIB_shortName :
- lshf
- GRIB_stepType :
- instant
- GRIB_stepUnits :
- 1
- GRIB_totalNumber :
- 0
- GRIB_typeOfLevel :
- surface
- GRIB_units :
- dimensionless
- long_name :
- Lake shape factor
- standard_name :
- unknown
- units :
- dimensionless
Array Chunk Bytes 12.90 TiB 45.00 MiB Shape (669096, 1472, 3600) (2880, 64, 64) Dask graph 305463 chunks in 2 graph layers Data type float32 numpy.ndarray - ltlt(valid_time, latitude, longitude)float32dask.array<chunksize=(2880, 64, 64), meta=np.ndarray>
- GRIB_NV :
- 0
- GRIB_Nx :
- 3600
- GRIB_Ny :
- 1472
- GRIB_cfName :
- unknown
- GRIB_cfVarName :
- ltlt
- GRIB_dataType :
- an
- GRIB_gridDefinitionDescription :
- Latitude/Longitude Grid
- GRIB_gridType :
- regular_ll
- GRIB_iDirectionIncrementInDegrees :
- 0.1
- GRIB_iScansNegatively :
- 0
- GRIB_jDirectionIncrementInDegrees :
- 0.1
- GRIB_jPointsAreConsecutive :
- 0
- GRIB_jScansPositively :
- 0
- GRIB_latitudeOfFirstGridPointInDegrees :
- 90.0
- GRIB_latitudeOfLastGridPointInDegrees :
- -57.1
- GRIB_longitudeOfFirstGridPointInDegrees :
- 0.0
- GRIB_longitudeOfLastGridPointInDegrees :
- 359.9
- GRIB_missingValue :
- 3.4028234663852886e+38
- GRIB_name :
- Lake total layer temperature
- GRIB_numberOfPoints :
- 5299200
- GRIB_paramId :
- 228011
- GRIB_shortName :
- ltlt
- GRIB_stepType :
- instant
- GRIB_stepUnits :
- 1
- GRIB_totalNumber :
- 0
- GRIB_typeOfLevel :
- surface
- GRIB_units :
- K
- long_name :
- Lake total layer temperature
- standard_name :
- unknown
- units :
- K
Array Chunk Bytes 12.90 TiB 45.00 MiB Shape (669096, 1472, 3600) (2880, 64, 64) Dask graph 305463 chunks in 2 graph layers Data type float32 numpy.ndarray - pev(valid_time, latitude, longitude)float32dask.array<chunksize=(2880, 64, 64), meta=np.ndarray>
- GRIB_NV :
- 0
- GRIB_Nx :
- 3600
- GRIB_Ny :
- 1472
- GRIB_cfName :
- unknown
- GRIB_cfVarName :
- pev
- GRIB_dataType :
- fc
- GRIB_gridDefinitionDescription :
- Latitude/Longitude Grid
- GRIB_gridType :
- regular_ll
- GRIB_iDirectionIncrementInDegrees :
- 0.1
- GRIB_iScansNegatively :
- 0
- GRIB_jDirectionIncrementInDegrees :
- 0.1
- GRIB_jPointsAreConsecutive :
- 0
- GRIB_jScansPositively :
- 0
- GRIB_latitudeOfFirstGridPointInDegrees :
- 90.0
- GRIB_latitudeOfLastGridPointInDegrees :
- -57.1
- GRIB_longitudeOfFirstGridPointInDegrees :
- 0.0
- GRIB_longitudeOfLastGridPointInDegrees :
- 359.9
- GRIB_missingValue :
- 3.4028234663852886e+38
- GRIB_name :
- Potential evaporation
- GRIB_numberOfPoints :
- 5299200
- GRIB_paramId :
- 228251
- GRIB_shortName :
- pev
- GRIB_stepType :
- accum
- GRIB_stepUnits :
- 1
- GRIB_totalNumber :
- 0
- GRIB_typeOfLevel :
- surface
- GRIB_units :
- m
- long_name :
- Potential evaporation
- standard_name :
- unknown
- units :
- m
Array Chunk Bytes 12.90 TiB 45.00 MiB Shape (669096, 1472, 3600) (2880, 64, 64) Dask graph 305463 chunks in 2 graph layers Data type float32 numpy.ndarray - ro(valid_time, latitude, longitude)float32dask.array<chunksize=(2880, 64, 64), meta=np.ndarray>
- GRIB_NV :
- 0
- GRIB_Nx :
- 3600
- GRIB_Ny :
- 1472
- GRIB_cfName :
- unknown
- GRIB_cfVarName :
- ro
- GRIB_dataType :
- fc
- GRIB_gridDefinitionDescription :
- Latitude/Longitude Grid
- GRIB_gridType :
- regular_ll
- GRIB_iDirectionIncrementInDegrees :
- 0.1
- GRIB_iScansNegatively :
- 0
- GRIB_jDirectionIncrementInDegrees :
- 0.1
- GRIB_jPointsAreConsecutive :
- 0
- GRIB_jScansPositively :
- 0
- GRIB_latitudeOfFirstGridPointInDegrees :
- 90.0
- GRIB_latitudeOfLastGridPointInDegrees :
- -57.1
- GRIB_longitudeOfFirstGridPointInDegrees :
- 0.0
- GRIB_longitudeOfLastGridPointInDegrees :
- 359.9
- GRIB_missingValue :
- 3.4028234663852886e+38
- GRIB_name :
- Runoff
- GRIB_numberOfPoints :
- 5299200
- GRIB_paramId :
- 205
- GRIB_shortName :
- ro
- GRIB_stepType :
- accum
- GRIB_stepUnits :
- 1
- GRIB_totalNumber :
- 0
- GRIB_typeOfLevel :
- surface
- GRIB_units :
- m
- long_name :
- Runoff
- standard_name :
- unknown
- units :
- m
Array Chunk Bytes 12.90 TiB 45.00 MiB Shape (669096, 1472, 3600) (2880, 64, 64) Dask graph 305463 chunks in 2 graph layers Data type float32 numpy.ndarray - rsn(valid_time, latitude, longitude)float32dask.array<chunksize=(2880, 64, 64), meta=np.ndarray>
- GRIB_NV :
- 0
- GRIB_Nx :
- 3600
- GRIB_Ny :
- 1472
- GRIB_cfName :
- unknown
- GRIB_cfVarName :
- rsn
- GRIB_dataType :
- an
- GRIB_gridDefinitionDescription :
- Latitude/Longitude Grid
- GRIB_gridType :
- regular_ll
- GRIB_iDirectionIncrementInDegrees :
- 0.1
- GRIB_iScansNegatively :
- 0
- GRIB_jDirectionIncrementInDegrees :
- 0.1
- GRIB_jPointsAreConsecutive :
- 0
- GRIB_jScansPositively :
- 0
- GRIB_latitudeOfFirstGridPointInDegrees :
- 90.0
- GRIB_latitudeOfLastGridPointInDegrees :
- -57.1
- GRIB_longitudeOfFirstGridPointInDegrees :
- 0.0
- GRIB_longitudeOfLastGridPointInDegrees :
- 359.9
- GRIB_missingValue :
- 3.4028234663852886e+38
- GRIB_name :
- Snow density
- GRIB_numberOfPoints :
- 5299200
- GRIB_paramId :
- 33
- GRIB_shortName :
- rsn
- GRIB_stepType :
- instant
- GRIB_stepUnits :
- 1
- GRIB_totalNumber :
- 0
- GRIB_typeOfLevel :
- surface
- GRIB_units :
- kg m**-3
- long_name :
- Snow density
- standard_name :
- unknown
- units :
- kg m**-3
Array Chunk Bytes 12.90 TiB 45.00 MiB Shape (669096, 1472, 3600) (2880, 64, 64) Dask graph 305463 chunks in 2 graph layers Data type float32 numpy.ndarray - sd(valid_time, latitude, longitude)float32dask.array<chunksize=(2880, 64, 64), meta=np.ndarray>
- GRIB_NV :
- 0
- GRIB_Nx :
- 3600
- GRIB_Ny :
- 1472
- GRIB_cfName :
- lwe_thickness_of_surface_snow_amount
- GRIB_cfVarName :
- sd
- GRIB_dataType :
- an
- GRIB_gridDefinitionDescription :
- Latitude/Longitude Grid
- GRIB_gridType :
- regular_ll
- GRIB_iDirectionIncrementInDegrees :
- 0.1
- GRIB_iScansNegatively :
- 0
- GRIB_jDirectionIncrementInDegrees :
- 0.1
- GRIB_jPointsAreConsecutive :
- 0
- GRIB_jScansPositively :
- 0
- GRIB_latitudeOfFirstGridPointInDegrees :
- 90.0
- GRIB_latitudeOfLastGridPointInDegrees :
- -57.1
- GRIB_longitudeOfFirstGridPointInDegrees :
- 0.0
- GRIB_longitudeOfLastGridPointInDegrees :
- 359.9
- GRIB_missingValue :
- 3.4028234663852886e+38
- GRIB_name :
- Snow depth
- GRIB_numberOfPoints :
- 5299200
- GRIB_paramId :
- 141
- GRIB_shortName :
- sd
- GRIB_stepType :
- instant
- GRIB_stepUnits :
- 1
- GRIB_totalNumber :
- 0
- GRIB_typeOfLevel :
- surface
- GRIB_units :
- m of water equivalent
- long_name :
- Snow depth
- standard_name :
- lwe_thickness_of_surface_snow_amount
- units :
- m of water equivalent
Array Chunk Bytes 12.90 TiB 45.00 MiB Shape (669096, 1472, 3600) (2880, 64, 64) Dask graph 305463 chunks in 2 graph layers Data type float32 numpy.ndarray - sde(valid_time, latitude, longitude)float32dask.array<chunksize=(2880, 64, 64), meta=np.ndarray>
- GRIB_NV :
- 0
- GRIB_Nx :
- 3600
- GRIB_Ny :
- 1472
- GRIB_cfName :
- lwe_thickness_of_surface_snow_amount
- GRIB_cfVarName :
- sde
- GRIB_dataType :
- fc
- GRIB_gridDefinitionDescription :
- Latitude/longitude
- GRIB_gridType :
- regular_ll
- GRIB_iDirectionIncrementInDegrees :
- 0.1
- GRIB_iScansNegatively :
- 0
- GRIB_jDirectionIncrementInDegrees :
- 0.1
- GRIB_jPointsAreConsecutive :
- 0
- GRIB_jScansPositively :
- 0
- GRIB_latitudeOfFirstGridPointInDegrees :
- 90.0
- GRIB_latitudeOfLastGridPointInDegrees :
- -57.1
- GRIB_longitudeOfFirstGridPointInDegrees :
- 0.0
- GRIB_longitudeOfLastGridPointInDegrees :
- 359.9
- GRIB_missingValue :
- 3.4028234663852886e+38
- GRIB_name :
- Snow depth
- GRIB_numberOfPoints :
- 5299200
- GRIB_paramId :
- 3066
- GRIB_shortName :
- sde
- GRIB_stepType :
- instant
- GRIB_stepUnits :
- 1
- GRIB_typeOfLevel :
- surface
- GRIB_units :
- m
- long_name :
- Snow depth
- standard_name :
- lwe_thickness_of_surface_snow_amount
- units :
- m
Array Chunk Bytes 12.90 TiB 45.00 MiB Shape (669096, 1472, 3600) (2880, 64, 64) Dask graph 305463 chunks in 2 graph layers Data type float32 numpy.ndarray - sf(valid_time, latitude, longitude)float32dask.array<chunksize=(2880, 64, 64), meta=np.ndarray>
- GRIB_NV :
- 0
- GRIB_Nx :
- 3600
- GRIB_Ny :
- 1472
- GRIB_cfName :
- lwe_thickness_of_snowfall_amount
- GRIB_cfVarName :
- sf
- GRIB_dataType :
- fc
- GRIB_gridDefinitionDescription :
- Latitude/Longitude Grid
- GRIB_gridType :
- regular_ll
- GRIB_iDirectionIncrementInDegrees :
- 0.1
- GRIB_iScansNegatively :
- 0
- GRIB_jDirectionIncrementInDegrees :
- 0.1
- GRIB_jPointsAreConsecutive :
- 0
- GRIB_jScansPositively :
- 0
- GRIB_latitudeOfFirstGridPointInDegrees :
- 90.0
- GRIB_latitudeOfLastGridPointInDegrees :
- -57.1
- GRIB_longitudeOfFirstGridPointInDegrees :
- 0.0
- GRIB_longitudeOfLastGridPointInDegrees :
- 359.9
- GRIB_missingValue :
- 3.4028234663852886e+38
- GRIB_name :
- Snowfall
- GRIB_numberOfPoints :
- 5299200
- GRIB_paramId :
- 144
- GRIB_shortName :
- sf
- GRIB_stepType :
- accum
- GRIB_stepUnits :
- 1
- GRIB_totalNumber :
- 0
- GRIB_typeOfLevel :
- surface
- GRIB_units :
- m of water equivalent
- long_name :
- Snowfall
- standard_name :
- lwe_thickness_of_snowfall_amount
- units :
- m of water equivalent
Array Chunk Bytes 12.90 TiB 45.00 MiB Shape (669096, 1472, 3600) (2880, 64, 64) Dask graph 305463 chunks in 2 graph layers Data type float32 numpy.ndarray - skt(valid_time, latitude, longitude)float32dask.array<chunksize=(2880, 64, 64), meta=np.ndarray>
- GRIB_NV :
- 0
- GRIB_Nx :
- 3600
- GRIB_Ny :
- 1472
- GRIB_cfName :
- unknown
- GRIB_cfVarName :
- skt
- GRIB_dataType :
- an
- GRIB_gridDefinitionDescription :
- Latitude/Longitude Grid
- GRIB_gridType :
- regular_ll
- GRIB_iDirectionIncrementInDegrees :
- 0.1
- GRIB_iScansNegatively :
- 0
- GRIB_jDirectionIncrementInDegrees :
- 0.1
- GRIB_jPointsAreConsecutive :
- 0
- GRIB_jScansPositively :
- 0
- GRIB_latitudeOfFirstGridPointInDegrees :
- 90.0
- GRIB_latitudeOfLastGridPointInDegrees :
- -57.1
- GRIB_longitudeOfFirstGridPointInDegrees :
- 0.0
- GRIB_longitudeOfLastGridPointInDegrees :
- 359.9
- GRIB_missingValue :
- 3.4028234663852886e+38
- GRIB_name :
- Skin temperature
- GRIB_numberOfPoints :
- 5299200
- GRIB_paramId :
- 235
- GRIB_shortName :
- skt
- GRIB_stepType :
- instant
- GRIB_stepUnits :
- 1
- GRIB_totalNumber :
- 0
- GRIB_typeOfLevel :
- surface
- GRIB_units :
- K
- long_name :
- Skin temperature
- standard_name :
- unknown
- units :
- K
Array Chunk Bytes 12.90 TiB 45.00 MiB Shape (669096, 1472, 3600) (2880, 64, 64) Dask graph 305463 chunks in 2 graph layers Data type float32 numpy.ndarray - slhf(valid_time, latitude, longitude)float32dask.array<chunksize=(2880, 64, 64), meta=np.ndarray>
- GRIB_NV :
- 0
- GRIB_Nx :
- 3600
- GRIB_Ny :
- 1472
- GRIB_cfName :
- surface_upward_latent_heat_flux
- GRIB_cfVarName :
- slhf
- GRIB_dataType :
- fc
- GRIB_gridDefinitionDescription :
- Latitude/Longitude Grid
- GRIB_gridType :
- regular_ll
- GRIB_iDirectionIncrementInDegrees :
- 0.1
- GRIB_iScansNegatively :
- 0
- GRIB_jDirectionIncrementInDegrees :
- 0.1
- GRIB_jPointsAreConsecutive :
- 0
- GRIB_jScansPositively :
- 0
- GRIB_latitudeOfFirstGridPointInDegrees :
- 90.0
- GRIB_latitudeOfLastGridPointInDegrees :
- -57.1
- GRIB_longitudeOfFirstGridPointInDegrees :
- 0.0
- GRIB_longitudeOfLastGridPointInDegrees :
- 359.9
- GRIB_missingValue :
- 3.4028234663852886e+38
- GRIB_name :
- Surface latent heat flux
- GRIB_numberOfPoints :
- 5299200
- GRIB_paramId :
- 147
- GRIB_shortName :
- slhf
- GRIB_stepType :
- accum
- GRIB_stepUnits :
- 1
- GRIB_totalNumber :
- 0
- GRIB_typeOfLevel :
- surface
- GRIB_units :
- J m**-2
- long_name :
- Surface latent heat flux
- standard_name :
- surface_upward_latent_heat_flux
- units :
- J m**-2
Array Chunk Bytes 12.90 TiB 45.00 MiB Shape (669096, 1472, 3600) (2880, 64, 64) Dask graph 305463 chunks in 2 graph layers Data type float32 numpy.ndarray - smlt(valid_time, latitude, longitude)float32dask.array<chunksize=(2880, 64, 64), meta=np.ndarray>
- GRIB_NV :
- 0
- GRIB_Nx :
- 3600
- GRIB_Ny :
- 1472
- GRIB_cfName :
- unknown
- GRIB_cfVarName :
- smlt
- GRIB_dataType :
- fc
- GRIB_gridDefinitionDescription :
- Latitude/Longitude Grid
- GRIB_gridType :
- regular_ll
- GRIB_iDirectionIncrementInDegrees :
- 0.1
- GRIB_iScansNegatively :
- 0
- GRIB_jDirectionIncrementInDegrees :
- 0.1
- GRIB_jPointsAreConsecutive :
- 0
- GRIB_jScansPositively :
- 0
- GRIB_latitudeOfFirstGridPointInDegrees :
- 90.0
- GRIB_latitudeOfLastGridPointInDegrees :
- -57.1
- GRIB_longitudeOfFirstGridPointInDegrees :
- 0.0
- GRIB_longitudeOfLastGridPointInDegrees :
- 359.9
- GRIB_missingValue :
- 3.4028234663852886e+38
- GRIB_name :
- Snowmelt
- GRIB_numberOfPoints :
- 5299200
- GRIB_paramId :
- 45
- GRIB_shortName :
- smlt
- GRIB_stepType :
- accum
- GRIB_stepUnits :
- 1
- GRIB_totalNumber :
- 0
- GRIB_typeOfLevel :
- surface
- GRIB_units :
- m of water equivalent
- long_name :
- Snowmelt
- standard_name :
- unknown
- units :
- m of water equivalent
Array Chunk Bytes 12.90 TiB 45.00 MiB Shape (669096, 1472, 3600) (2880, 64, 64) Dask graph 305463 chunks in 2 graph layers Data type float32 numpy.ndarray - snowc(valid_time, latitude, longitude)float32dask.array<chunksize=(2880, 64, 64), meta=np.ndarray>
- GRIB_NV :
- 0
- GRIB_Nx :
- 3600
- GRIB_Ny :
- 1472
- GRIB_cfName :
- unknown
- GRIB_cfVarName :
- snowc
- GRIB_dataType :
- fc
- GRIB_gridDefinitionDescription :
- Latitude/longitude
- GRIB_gridType :
- regular_ll
- GRIB_iDirectionIncrementInDegrees :
- 0.1
- GRIB_iScansNegatively :
- 0
- GRIB_jDirectionIncrementInDegrees :
- 0.1
- GRIB_jPointsAreConsecutive :
- 0
- GRIB_jScansPositively :
- 0
- GRIB_latitudeOfFirstGridPointInDegrees :
- 90.0
- GRIB_latitudeOfLastGridPointInDegrees :
- -57.1
- GRIB_longitudeOfFirstGridPointInDegrees :
- 0.0
- GRIB_longitudeOfLastGridPointInDegrees :
- 359.9
- GRIB_missingValue :
- 3.4028234663852886e+38
- GRIB_name :
- Snow cover
- GRIB_numberOfPoints :
- 5299200
- GRIB_paramId :
- 260038
- GRIB_shortName :
- snowc
- GRIB_stepType :
- instant
- GRIB_stepUnits :
- 1
- GRIB_typeOfLevel :
- surface
- GRIB_units :
- %
- long_name :
- Snow cover
- standard_name :
- unknown
- units :
- %
Array Chunk Bytes 12.90 TiB 45.00 MiB Shape (669096, 1472, 3600) (2880, 64, 64) Dask graph 305463 chunks in 2 graph layers Data type float32 numpy.ndarray - sp(valid_time, latitude, longitude)float32dask.array<chunksize=(2880, 64, 64), meta=np.ndarray>
- GRIB_NV :
- 0
- GRIB_Nx :
- 3600
- GRIB_Ny :
- 1472
- GRIB_cfName :
- surface_air_pressure
- GRIB_cfVarName :
- sp
- GRIB_dataType :
- fc
- GRIB_gridDefinitionDescription :
- Latitude/Longitude Grid
- GRIB_gridType :
- regular_ll
- GRIB_iDirectionIncrementInDegrees :
- 0.1
- GRIB_iScansNegatively :
- 0
- GRIB_jDirectionIncrementInDegrees :
- 0.1
- GRIB_jPointsAreConsecutive :
- 0
- GRIB_jScansPositively :
- 0
- GRIB_latitudeOfFirstGridPointInDegrees :
- 90.0
- GRIB_latitudeOfLastGridPointInDegrees :
- -57.1
- GRIB_longitudeOfFirstGridPointInDegrees :
- 0.0
- GRIB_longitudeOfLastGridPointInDegrees :
- 359.9
- GRIB_missingValue :
- 3.4028234663852886e+38
- GRIB_name :
- Surface pressure
- GRIB_numberOfPoints :
- 5299200
- GRIB_paramId :
- 134
- GRIB_shortName :
- sp
- GRIB_stepType :
- instant
- GRIB_stepUnits :
- 1
- GRIB_totalNumber :
- 0
- GRIB_typeOfLevel :
- surface
- GRIB_units :
- Pa
- long_name :
- Surface pressure
- standard_name :
- surface_air_pressure
- units :
- Pa
Array Chunk Bytes 12.90 TiB 45.00 MiB Shape (669096, 1472, 3600) (2880, 64, 64) Dask graph 305463 chunks in 2 graph layers Data type float32 numpy.ndarray - src(valid_time, latitude, longitude)float32dask.array<chunksize=(2880, 64, 64), meta=np.ndarray>
- GRIB_NV :
- 0
- GRIB_Nx :
- 3600
- GRIB_Ny :
- 1472
- GRIB_cfName :
- unknown
- GRIB_cfVarName :
- src
- GRIB_dataType :
- an
- GRIB_gridDefinitionDescription :
- Latitude/Longitude Grid
- GRIB_gridType :
- regular_ll
- GRIB_iDirectionIncrementInDegrees :
- 0.1
- GRIB_iScansNegatively :
- 0
- GRIB_jDirectionIncrementInDegrees :
- 0.1
- GRIB_jPointsAreConsecutive :
- 0
- GRIB_jScansPositively :
- 0
- GRIB_latitudeOfFirstGridPointInDegrees :
- 90.0
- GRIB_latitudeOfLastGridPointInDegrees :
- -57.1
- GRIB_longitudeOfFirstGridPointInDegrees :
- 0.0
- GRIB_longitudeOfLastGridPointInDegrees :
- 359.9
- GRIB_missingValue :
- 3.4028234663852886e+38
- GRIB_name :
- Skin reservoir content
- GRIB_numberOfPoints :
- 5299200
- GRIB_paramId :
- 198
- GRIB_shortName :
- src
- GRIB_stepType :
- instant
- GRIB_stepUnits :
- 1
- GRIB_totalNumber :
- 0
- GRIB_typeOfLevel :
- surface
- GRIB_units :
- m of water equivalent
- long_name :
- Skin reservoir content
- standard_name :
- unknown
- units :
- m of water equivalent
Array Chunk Bytes 12.90 TiB 45.00 MiB Shape (669096, 1472, 3600) (2880, 64, 64) Dask graph 305463 chunks in 2 graph layers Data type float32 numpy.ndarray - sro(valid_time, latitude, longitude)float32dask.array<chunksize=(2880, 64, 64), meta=np.ndarray>
- GRIB_NV :
- 0
- GRIB_Nx :
- 3600
- GRIB_Ny :
- 1472
- GRIB_cfName :
- unknown
- GRIB_cfVarName :
- sro
- GRIB_dataType :
- fc
- GRIB_gridDefinitionDescription :
- Latitude/Longitude Grid
- GRIB_gridType :
- regular_ll
- GRIB_iDirectionIncrementInDegrees :
- 0.1
- GRIB_iScansNegatively :
- 0
- GRIB_jDirectionIncrementInDegrees :
- 0.1
- GRIB_jPointsAreConsecutive :
- 0
- GRIB_jScansPositively :
- 0
- GRIB_latitudeOfFirstGridPointInDegrees :
- 90.0
- GRIB_latitudeOfLastGridPointInDegrees :
- -57.1
- GRIB_longitudeOfFirstGridPointInDegrees :
- 0.0
- GRIB_longitudeOfLastGridPointInDegrees :
- 359.9
- GRIB_missingValue :
- 3.4028234663852886e+38
- GRIB_name :
- Surface runoff
- GRIB_numberOfPoints :
- 5299200
- GRIB_paramId :
- 8
- GRIB_shortName :
- sro
- GRIB_stepType :
- accum
- GRIB_stepUnits :
- 1
- GRIB_totalNumber :
- 0
- GRIB_typeOfLevel :
- surface
- GRIB_units :
- m
- long_name :
- Surface runoff
- standard_name :
- unknown
- units :
- m
Array Chunk Bytes 12.90 TiB 45.00 MiB Shape (669096, 1472, 3600) (2880, 64, 64) Dask graph 305463 chunks in 2 graph layers Data type float32 numpy.ndarray - sshf(valid_time, latitude, longitude)float32dask.array<chunksize=(2880, 64, 64), meta=np.ndarray>
- GRIB_NV :
- 0
- GRIB_Nx :
- 3600
- GRIB_Ny :
- 1472
- GRIB_cfName :
- surface_upward_sensible_heat_flux
- GRIB_cfVarName :
- sshf
- GRIB_dataType :
- fc
- GRIB_gridDefinitionDescription :
- Latitude/Longitude Grid
- GRIB_gridType :
- regular_ll
- GRIB_iDirectionIncrementInDegrees :
- 0.1
- GRIB_iScansNegatively :
- 0
- GRIB_jDirectionIncrementInDegrees :
- 0.1
- GRIB_jPointsAreConsecutive :
- 0
- GRIB_jScansPositively :
- 0
- GRIB_latitudeOfFirstGridPointInDegrees :
- 90.0
- GRIB_latitudeOfLastGridPointInDegrees :
- -57.1
- GRIB_longitudeOfFirstGridPointInDegrees :
- 0.0
- GRIB_longitudeOfLastGridPointInDegrees :
- 359.9
- GRIB_missingValue :
- 3.4028234663852886e+38
- GRIB_name :
- Surface sensible heat flux
- GRIB_numberOfPoints :
- 5299200
- GRIB_paramId :
- 146
- GRIB_shortName :
- sshf
- GRIB_stepType :
- accum
- GRIB_stepUnits :
- 1
- GRIB_totalNumber :
- 0
- GRIB_typeOfLevel :
- surface
- GRIB_units :
- J m**-2
- long_name :
- Surface sensible heat flux
- standard_name :
- surface_upward_sensible_heat_flux
- units :
- J m**-2
Array Chunk Bytes 12.90 TiB 45.00 MiB Shape (669096, 1472, 3600) (2880, 64, 64) Dask graph 305463 chunks in 2 graph layers Data type float32 numpy.ndarray - ssr(valid_time, latitude, longitude)float32dask.array<chunksize=(2880, 64, 64), meta=np.ndarray>
- GRIB_NV :
- 0
- GRIB_Nx :
- 3600
- GRIB_Ny :
- 1472
- GRIB_cfName :
- surface_net_downward_shortwave_flux
- GRIB_cfVarName :
- ssr
- GRIB_dataType :
- fc
- GRIB_gridDefinitionDescription :
- Latitude/Longitude Grid
- GRIB_gridType :
- regular_ll
- GRIB_iDirectionIncrementInDegrees :
- 0.1
- GRIB_iScansNegatively :
- 0
- GRIB_jDirectionIncrementInDegrees :
- 0.1
- GRIB_jPointsAreConsecutive :
- 0
- GRIB_jScansPositively :
- 0
- GRIB_latitudeOfFirstGridPointInDegrees :
- 90.0
- GRIB_latitudeOfLastGridPointInDegrees :
- -57.1
- GRIB_longitudeOfFirstGridPointInDegrees :
- 0.0
- GRIB_longitudeOfLastGridPointInDegrees :
- 359.9
- GRIB_missingValue :
- 3.4028234663852886e+38
- GRIB_name :
- Surface net short-wave (solar) radiation
- GRIB_numberOfPoints :
- 5299200
- GRIB_paramId :
- 176
- GRIB_shortName :
- ssr
- GRIB_stepType :
- accum
- GRIB_stepUnits :
- 1
- GRIB_totalNumber :
- 0
- GRIB_typeOfLevel :
- surface
- GRIB_units :
- J m**-2
- long_name :
- Surface net short-wave (solar) radiation
- standard_name :
- surface_net_downward_shortwave_flux
- units :
- J m**-2
Array Chunk Bytes 12.90 TiB 45.00 MiB Shape (669096, 1472, 3600) (2880, 64, 64) Dask graph 305463 chunks in 2 graph layers Data type float32 numpy.ndarray - ssrd(valid_time, latitude, longitude)float32dask.array<chunksize=(2880, 64, 64), meta=np.ndarray>
- GRIB_NV :
- 0
- GRIB_Nx :
- 3600
- GRIB_Ny :
- 1472
- GRIB_cfName :
- surface_downwelling_shortwave_flux_in_air
- GRIB_cfVarName :
- ssrd
- GRIB_dataType :
- fc
- GRIB_gridDefinitionDescription :
- Latitude/Longitude Grid
- GRIB_gridType :
- regular_ll
- GRIB_iDirectionIncrementInDegrees :
- 0.1
- GRIB_iScansNegatively :
- 0
- GRIB_jDirectionIncrementInDegrees :
- 0.1
- GRIB_jPointsAreConsecutive :
- 0
- GRIB_jScansPositively :
- 0
- GRIB_latitudeOfFirstGridPointInDegrees :
- 90.0
- GRIB_latitudeOfLastGridPointInDegrees :
- -57.1
- GRIB_longitudeOfFirstGridPointInDegrees :
- 0.0
- GRIB_longitudeOfLastGridPointInDegrees :
- 359.9
- GRIB_missingValue :
- 3.4028234663852886e+38
- GRIB_name :
- Surface short-wave (solar) radiation downwards
- GRIB_numberOfPoints :
- 5299200
- GRIB_paramId :
- 169
- GRIB_shortName :
- ssrd
- GRIB_stepType :
- accum
- GRIB_stepUnits :
- 1
- GRIB_totalNumber :
- 0
- GRIB_typeOfLevel :
- surface
- GRIB_units :
- J m**-2
- long_name :
- Surface short-wave (solar) radiation downwards
- standard_name :
- surface_downwelling_shortwave_flux_in_air
- units :
- J m**-2
Array Chunk Bytes 12.90 TiB 45.00 MiB Shape (669096, 1472, 3600) (2880, 64, 64) Dask graph 305463 chunks in 2 graph layers Data type float32 numpy.ndarray - ssro(valid_time, latitude, longitude)float32dask.array<chunksize=(2880, 64, 64), meta=np.ndarray>
- GRIB_NV :
- 0
- GRIB_Nx :
- 3600
- GRIB_Ny :
- 1472
- GRIB_cfName :
- unknown
- GRIB_cfVarName :
- ssro
- GRIB_dataType :
- fc
- GRIB_gridDefinitionDescription :
- Latitude/Longitude Grid
- GRIB_gridType :
- regular_ll
- GRIB_iDirectionIncrementInDegrees :
- 0.1
- GRIB_iScansNegatively :
- 0
- GRIB_jDirectionIncrementInDegrees :
- 0.1
- GRIB_jPointsAreConsecutive :
- 0
- GRIB_jScansPositively :
- 0
- GRIB_latitudeOfFirstGridPointInDegrees :
- 90.0
- GRIB_latitudeOfLastGridPointInDegrees :
- -57.1
- GRIB_longitudeOfFirstGridPointInDegrees :
- 0.0
- GRIB_longitudeOfLastGridPointInDegrees :
- 359.9
- GRIB_missingValue :
- 3.4028234663852886e+38
- GRIB_name :
- Sub-surface runoff
- GRIB_numberOfPoints :
- 5299200
- GRIB_paramId :
- 9
- GRIB_shortName :
- ssro
- GRIB_stepType :
- accum
- GRIB_stepUnits :
- 1
- GRIB_totalNumber :
- 0
- GRIB_typeOfLevel :
- surface
- GRIB_units :
- m
- long_name :
- Sub-surface runoff
- standard_name :
- unknown
- units :
- m
Array Chunk Bytes 12.90 TiB 45.00 MiB Shape (669096, 1472, 3600) (2880, 64, 64) Dask graph 305463 chunks in 2 graph layers Data type float32 numpy.ndarray - stl1(valid_time, latitude, longitude)float32dask.array<chunksize=(2880, 64, 64), meta=np.ndarray>
- GRIB_NV :
- 0
- GRIB_Nx :
- 3600
- GRIB_Ny :
- 1472
- GRIB_cfName :
- surface_temperature
- GRIB_cfVarName :
- stl1
- GRIB_dataType :
- an
- GRIB_gridDefinitionDescription :
- Latitude/Longitude Grid
- GRIB_gridType :
- regular_ll
- GRIB_iDirectionIncrementInDegrees :
- 0.1
- GRIB_iScansNegatively :
- 0
- GRIB_jDirectionIncrementInDegrees :
- 0.1
- GRIB_jPointsAreConsecutive :
- 0
- GRIB_jScansPositively :
- 0
- GRIB_latitudeOfFirstGridPointInDegrees :
- 90.0
- GRIB_latitudeOfLastGridPointInDegrees :
- -57.1
- GRIB_longitudeOfFirstGridPointInDegrees :
- 0.0
- GRIB_longitudeOfLastGridPointInDegrees :
- 359.9
- GRIB_missingValue :
- 3.4028234663852886e+38
- GRIB_name :
- Soil temperature level 1
- GRIB_numberOfPoints :
- 5299200
- GRIB_paramId :
- 139
- GRIB_shortName :
- stl1
- GRIB_stepType :
- instant
- GRIB_stepUnits :
- 1
- GRIB_totalNumber :
- 0
- GRIB_typeOfLevel :
- depthBelowLandLayer
- GRIB_units :
- K
- long_name :
- Soil temperature level 1
- standard_name :
- surface_temperature
- units :
- K
Array Chunk Bytes 12.90 TiB 45.00 MiB Shape (669096, 1472, 3600) (2880, 64, 64) Dask graph 305463 chunks in 2 graph layers Data type float32 numpy.ndarray - stl2(valid_time, latitude, longitude)float32dask.array<chunksize=(2880, 64, 64), meta=np.ndarray>
- GRIB_NV :
- 0
- GRIB_Nx :
- 3600
- GRIB_Ny :
- 1472
- GRIB_cfName :
- unknown
- GRIB_cfVarName :
- stl2
- GRIB_dataType :
- an
- GRIB_gridDefinitionDescription :
- Latitude/Longitude Grid
- GRIB_gridType :
- regular_ll
- GRIB_iDirectionIncrementInDegrees :
- 0.1
- GRIB_iScansNegatively :
- 0
- GRIB_jDirectionIncrementInDegrees :
- 0.1
- GRIB_jPointsAreConsecutive :
- 0
- GRIB_jScansPositively :
- 0
- GRIB_latitudeOfFirstGridPointInDegrees :
- 90.0
- GRIB_latitudeOfLastGridPointInDegrees :
- -57.1
- GRIB_longitudeOfFirstGridPointInDegrees :
- 0.0
- GRIB_longitudeOfLastGridPointInDegrees :
- 359.9
- GRIB_missingValue :
- 3.4028234663852886e+38
- GRIB_name :
- Soil temperature level 2
- GRIB_numberOfPoints :
- 5299200
- GRIB_paramId :
- 170
- GRIB_shortName :
- stl2
- GRIB_stepType :
- instant
- GRIB_stepUnits :
- 1
- GRIB_totalNumber :
- 0
- GRIB_typeOfLevel :
- depthBelowLandLayer
- GRIB_units :
- K
- long_name :
- Soil temperature level 2
- standard_name :
- unknown
- units :
- K
Array Chunk Bytes 12.90 TiB 45.00 MiB Shape (669096, 1472, 3600) (2880, 64, 64) Dask graph 305463 chunks in 2 graph layers Data type float32 numpy.ndarray - stl3(valid_time, latitude, longitude)float32dask.array<chunksize=(2880, 64, 64), meta=np.ndarray>
- GRIB_NV :
- 0
- GRIB_Nx :
- 3600
- GRIB_Ny :
- 1472
- GRIB_cfName :
- unknown
- GRIB_cfVarName :
- stl3
- GRIB_dataType :
- an
- GRIB_gridDefinitionDescription :
- Latitude/Longitude Grid
- GRIB_gridType :
- regular_ll
- GRIB_iDirectionIncrementInDegrees :
- 0.1
- GRIB_iScansNegatively :
- 0
- GRIB_jDirectionIncrementInDegrees :
- 0.1
- GRIB_jPointsAreConsecutive :
- 0
- GRIB_jScansPositively :
- 0
- GRIB_latitudeOfFirstGridPointInDegrees :
- 90.0
- GRIB_latitudeOfLastGridPointInDegrees :
- -57.1
- GRIB_longitudeOfFirstGridPointInDegrees :
- 0.0
- GRIB_longitudeOfLastGridPointInDegrees :
- 359.9
- GRIB_missingValue :
- 3.4028234663852886e+38
- GRIB_name :
- Soil temperature level 3
- GRIB_numberOfPoints :
- 5299200
- GRIB_paramId :
- 183
- GRIB_shortName :
- stl3
- GRIB_stepType :
- instant
- GRIB_stepUnits :
- 1
- GRIB_totalNumber :
- 0
- GRIB_typeOfLevel :
- depthBelowLandLayer
- GRIB_units :
- K
- long_name :
- Soil temperature level 3
- standard_name :
- unknown
- units :
- K
Array Chunk Bytes 12.90 TiB 45.00 MiB Shape (669096, 1472, 3600) (2880, 64, 64) Dask graph 305463 chunks in 2 graph layers Data type float32 numpy.ndarray - stl4(valid_time, latitude, longitude)float32dask.array<chunksize=(2880, 64, 64), meta=np.ndarray>
- GRIB_NV :
- 0
- GRIB_Nx :
- 3600
- GRIB_Ny :
- 1472
- GRIB_cfName :
- unknown
- GRIB_cfVarName :
- stl4
- GRIB_dataType :
- an
- GRIB_gridDefinitionDescription :
- Latitude/Longitude Grid
- GRIB_gridType :
- regular_ll
- GRIB_iDirectionIncrementInDegrees :
- 0.1
- GRIB_iScansNegatively :
- 0
- GRIB_jDirectionIncrementInDegrees :
- 0.1
- GRIB_jPointsAreConsecutive :
- 0
- GRIB_jScansPositively :
- 0
- GRIB_latitudeOfFirstGridPointInDegrees :
- 90.0
- GRIB_latitudeOfLastGridPointInDegrees :
- -57.1
- GRIB_longitudeOfFirstGridPointInDegrees :
- 0.0
- GRIB_longitudeOfLastGridPointInDegrees :
- 359.9
- GRIB_missingValue :
- 3.4028234663852886e+38
- GRIB_name :
- Soil temperature level 4
- GRIB_numberOfPoints :
- 5299200
- GRIB_paramId :
- 236
- GRIB_shortName :
- stl4
- GRIB_stepType :
- instant
- GRIB_stepUnits :
- 1
- GRIB_totalNumber :
- 0
- GRIB_typeOfLevel :
- depthBelowLandLayer
- GRIB_units :
- K
- long_name :
- Soil temperature level 4
- standard_name :
- unknown
- units :
- K
Array Chunk Bytes 12.90 TiB 45.00 MiB Shape (669096, 1472, 3600) (2880, 64, 64) Dask graph 305463 chunks in 2 graph layers Data type float32 numpy.ndarray - str(valid_time, latitude, longitude)float32dask.array<chunksize=(2880, 64, 64), meta=np.ndarray>
- GRIB_NV :
- 0
- GRIB_Nx :
- 3600
- GRIB_Ny :
- 1472
- GRIB_cfName :
- surface_net_upward_longwave_flux
- GRIB_cfVarName :
- str
- GRIB_dataType :
- fc
- GRIB_gridDefinitionDescription :
- Latitude/Longitude Grid
- GRIB_gridType :
- regular_ll
- GRIB_iDirectionIncrementInDegrees :
- 0.1
- GRIB_iScansNegatively :
- 0
- GRIB_jDirectionIncrementInDegrees :
- 0.1
- GRIB_jPointsAreConsecutive :
- 0
- GRIB_jScansPositively :
- 0
- GRIB_latitudeOfFirstGridPointInDegrees :
- 90.0
- GRIB_latitudeOfLastGridPointInDegrees :
- -57.1
- GRIB_longitudeOfFirstGridPointInDegrees :
- 0.0
- GRIB_longitudeOfLastGridPointInDegrees :
- 359.9
- GRIB_missingValue :
- 3.4028234663852886e+38
- GRIB_name :
- Surface net long-wave (thermal) radiation
- GRIB_numberOfPoints :
- 5299200
- GRIB_paramId :
- 177
- GRIB_shortName :
- str
- GRIB_stepType :
- accum
- GRIB_stepUnits :
- 1
- GRIB_totalNumber :
- 0
- GRIB_typeOfLevel :
- surface
- GRIB_units :
- J m**-2
- long_name :
- Surface net long-wave (thermal) radiation
- standard_name :
- surface_net_upward_longwave_flux
- units :
- J m**-2
Array Chunk Bytes 12.90 TiB 45.00 MiB Shape (669096, 1472, 3600) (2880, 64, 64) Dask graph 305463 chunks in 2 graph layers Data type float32 numpy.ndarray - strd(valid_time, latitude, longitude)float32dask.array<chunksize=(2880, 64, 64), meta=np.ndarray>
- GRIB_NV :
- 0
- GRIB_Nx :
- 3600
- GRIB_Ny :
- 1472
- GRIB_cfName :
- unknown
- GRIB_cfVarName :
- strd
- GRIB_dataType :
- fc
- GRIB_gridDefinitionDescription :
- Latitude/Longitude Grid
- GRIB_gridType :
- regular_ll
- GRIB_iDirectionIncrementInDegrees :
- 0.1
- GRIB_iScansNegatively :
- 0
- GRIB_jDirectionIncrementInDegrees :
- 0.1
- GRIB_jPointsAreConsecutive :
- 0
- GRIB_jScansPositively :
- 0
- GRIB_latitudeOfFirstGridPointInDegrees :
- 90.0
- GRIB_latitudeOfLastGridPointInDegrees :
- -57.1
- GRIB_longitudeOfFirstGridPointInDegrees :
- 0.0
- GRIB_longitudeOfLastGridPointInDegrees :
- 359.9
- GRIB_missingValue :
- 3.4028234663852886e+38
- GRIB_name :
- Surface long-wave (thermal) radiation downwards
- GRIB_numberOfPoints :
- 5299200
- GRIB_paramId :
- 175
- GRIB_shortName :
- strd
- GRIB_stepType :
- accum
- GRIB_stepUnits :
- 1
- GRIB_totalNumber :
- 0
- GRIB_typeOfLevel :
- surface
- GRIB_units :
- J m**-2
- long_name :
- Surface long-wave (thermal) radiation downwards
- standard_name :
- unknown
- units :
- J m**-2
Array Chunk Bytes 12.90 TiB 45.00 MiB Shape (669096, 1472, 3600) (2880, 64, 64) Dask graph 305463 chunks in 2 graph layers Data type float32 numpy.ndarray - swvl1(valid_time, latitude, longitude)float32dask.array<chunksize=(2880, 64, 64), meta=np.ndarray>
- GRIB_NV :
- 0
- GRIB_Nx :
- 3600
- GRIB_Ny :
- 1472
- GRIB_cfName :
- unknown
- GRIB_cfVarName :
- swvl1
- GRIB_dataType :
- an
- GRIB_gridDefinitionDescription :
- Latitude/Longitude Grid
- GRIB_gridType :
- regular_ll
- GRIB_iDirectionIncrementInDegrees :
- 0.1
- GRIB_iScansNegatively :
- 0
- GRIB_jDirectionIncrementInDegrees :
- 0.1
- GRIB_jPointsAreConsecutive :
- 0
- GRIB_jScansPositively :
- 0
- GRIB_latitudeOfFirstGridPointInDegrees :
- 90.0
- GRIB_latitudeOfLastGridPointInDegrees :
- -57.1
- GRIB_longitudeOfFirstGridPointInDegrees :
- 0.0
- GRIB_longitudeOfLastGridPointInDegrees :
- 359.9
- GRIB_missingValue :
- 3.4028234663852886e+38
- GRIB_name :
- Volumetric soil water layer 1
- GRIB_numberOfPoints :
- 5299200
- GRIB_paramId :
- 39
- GRIB_shortName :
- swvl1
- GRIB_stepType :
- instant
- GRIB_stepUnits :
- 1
- GRIB_totalNumber :
- 0
- GRIB_typeOfLevel :
- depthBelowLandLayer
- GRIB_units :
- m**3 m**-3
- long_name :
- Volumetric soil water layer 1
- standard_name :
- unknown
- units :
- m**3 m**-3
Array Chunk Bytes 12.90 TiB 45.00 MiB Shape (669096, 1472, 3600) (2880, 64, 64) Dask graph 305463 chunks in 2 graph layers Data type float32 numpy.ndarray - swvl2(valid_time, latitude, longitude)float32dask.array<chunksize=(2880, 64, 64), meta=np.ndarray>
- GRIB_NV :
- 0
- GRIB_Nx :
- 3600
- GRIB_Ny :
- 1472
- GRIB_cfName :
- unknown
- GRIB_cfVarName :
- swvl2
- GRIB_dataType :
- an
- GRIB_gridDefinitionDescription :
- Latitude/Longitude Grid
- GRIB_gridType :
- regular_ll
- GRIB_iDirectionIncrementInDegrees :
- 0.1
- GRIB_iScansNegatively :
- 0
- GRIB_jDirectionIncrementInDegrees :
- 0.1
- GRIB_jPointsAreConsecutive :
- 0
- GRIB_jScansPositively :
- 0
- GRIB_latitudeOfFirstGridPointInDegrees :
- 90.0
- GRIB_latitudeOfLastGridPointInDegrees :
- -57.1
- GRIB_longitudeOfFirstGridPointInDegrees :
- 0.0
- GRIB_longitudeOfLastGridPointInDegrees :
- 359.9
- GRIB_missingValue :
- 3.4028234663852886e+38
- GRIB_name :
- Volumetric soil water layer 2
- GRIB_numberOfPoints :
- 5299200
- GRIB_paramId :
- 40
- GRIB_shortName :
- swvl2
- GRIB_stepType :
- instant
- GRIB_stepUnits :
- 1
- GRIB_totalNumber :
- 0
- GRIB_typeOfLevel :
- depthBelowLandLayer
- GRIB_units :
- m**3 m**-3
- long_name :
- Volumetric soil water layer 2
- standard_name :
- unknown
- units :
- m**3 m**-3
Array Chunk Bytes 12.90 TiB 45.00 MiB Shape (669096, 1472, 3600) (2880, 64, 64) Dask graph 305463 chunks in 2 graph layers Data type float32 numpy.ndarray - swvl3(valid_time, latitude, longitude)float32dask.array<chunksize=(2880, 64, 64), meta=np.ndarray>
- GRIB_NV :
- 0
- GRIB_Nx :
- 3600
- GRIB_Ny :
- 1472
- GRIB_cfName :
- unknown
- GRIB_cfVarName :
- swvl3
- GRIB_dataType :
- an
- GRIB_gridDefinitionDescription :
- Latitude/Longitude Grid
- GRIB_gridType :
- regular_ll
- GRIB_iDirectionIncrementInDegrees :
- 0.1
- GRIB_iScansNegatively :
- 0
- GRIB_jDirectionIncrementInDegrees :
- 0.1
- GRIB_jPointsAreConsecutive :
- 0
- GRIB_jScansPositively :
- 0
- GRIB_latitudeOfFirstGridPointInDegrees :
- 90.0
- GRIB_latitudeOfLastGridPointInDegrees :
- -57.1
- GRIB_longitudeOfFirstGridPointInDegrees :
- 0.0
- GRIB_longitudeOfLastGridPointInDegrees :
- 359.9
- GRIB_missingValue :
- 3.4028234663852886e+38
- GRIB_name :
- Volumetric soil water layer 3
- GRIB_numberOfPoints :
- 5299200
- GRIB_paramId :
- 41
- GRIB_shortName :
- swvl3
- GRIB_stepType :
- instant
- GRIB_stepUnits :
- 1
- GRIB_totalNumber :
- 0
- GRIB_typeOfLevel :
- depthBelowLandLayer
- GRIB_units :
- m**3 m**-3
- long_name :
- Volumetric soil water layer 3
- standard_name :
- unknown
- units :
- m**3 m**-3
Array Chunk Bytes 12.90 TiB 45.00 MiB Shape (669096, 1472, 3600) (2880, 64, 64) Dask graph 305463 chunks in 2 graph layers Data type float32 numpy.ndarray - swvl4(valid_time, latitude, longitude)float32dask.array<chunksize=(2880, 64, 64), meta=np.ndarray>
- GRIB_NV :
- 0
- GRIB_Nx :
- 3600
- GRIB_Ny :
- 1472
- GRIB_cfName :
- unknown
- GRIB_cfVarName :
- swvl4
- GRIB_dataType :
- an
- GRIB_gridDefinitionDescription :
- Latitude/Longitude Grid
- GRIB_gridType :
- regular_ll
- GRIB_iDirectionIncrementInDegrees :
- 0.1
- GRIB_iScansNegatively :
- 0
- GRIB_jDirectionIncrementInDegrees :
- 0.1
- GRIB_jPointsAreConsecutive :
- 0
- GRIB_jScansPositively :
- 0
- GRIB_latitudeOfFirstGridPointInDegrees :
- 90.0
- GRIB_latitudeOfLastGridPointInDegrees :
- -57.1
- GRIB_longitudeOfFirstGridPointInDegrees :
- 0.0
- GRIB_longitudeOfLastGridPointInDegrees :
- 359.9
- GRIB_missingValue :
- 3.4028234663852886e+38
- GRIB_name :
- Volumetric soil water layer 4
- GRIB_numberOfPoints :
- 5299200
- GRIB_paramId :
- 42
- GRIB_shortName :
- swvl4
- GRIB_stepType :
- instant
- GRIB_stepUnits :
- 1
- GRIB_totalNumber :
- 0
- GRIB_typeOfLevel :
- depthBelowLandLayer
- GRIB_units :
- m**3 m**-3
- long_name :
- Volumetric soil water layer 4
- standard_name :
- unknown
- units :
- m**3 m**-3
Array Chunk Bytes 12.90 TiB 45.00 MiB Shape (669096, 1472, 3600) (2880, 64, 64) Dask graph 305463 chunks in 2 graph layers Data type float32 numpy.ndarray - t2m(valid_time, latitude, longitude)float32dask.array<chunksize=(2880, 64, 64), meta=np.ndarray>
- GRIB_NV :
- 0
- GRIB_Nx :
- 3600
- GRIB_Ny :
- 1472
- GRIB_cfName :
- unknown
- GRIB_cfVarName :
- t2m
- GRIB_dataType :
- fc
- GRIB_gridDefinitionDescription :
- Latitude/Longitude Grid
- GRIB_gridType :
- regular_ll
- GRIB_iDirectionIncrementInDegrees :
- 0.1
- GRIB_iScansNegatively :
- 0
- GRIB_jDirectionIncrementInDegrees :
- 0.1
- GRIB_jPointsAreConsecutive :
- 0
- GRIB_jScansPositively :
- 0
- GRIB_latitudeOfFirstGridPointInDegrees :
- 90.0
- GRIB_latitudeOfLastGridPointInDegrees :
- -57.1
- GRIB_longitudeOfFirstGridPointInDegrees :
- 0.0
- GRIB_longitudeOfLastGridPointInDegrees :
- 359.9
- GRIB_missingValue :
- 3.4028234663852886e+38
- GRIB_name :
- 2 metre temperature
- GRIB_numberOfPoints :
- 5299200
- GRIB_paramId :
- 167
- GRIB_shortName :
- 2t
- GRIB_stepType :
- instant
- GRIB_stepUnits :
- 1
- GRIB_totalNumber :
- 0
- GRIB_typeOfLevel :
- surface
- GRIB_units :
- K
- long_name :
- 2 metre temperature
- standard_name :
- unknown
- units :
- K
Array Chunk Bytes 12.90 TiB 45.00 MiB Shape (669096, 1472, 3600) (2880, 64, 64) Dask graph 305463 chunks in 2 graph layers Data type float32 numpy.ndarray - tp(valid_time, latitude, longitude)float32dask.array<chunksize=(2880, 64, 64), meta=np.ndarray>
- GRIB_NV :
- 0
- GRIB_Nx :
- 3600
- GRIB_Ny :
- 1472
- GRIB_cfName :
- unknown
- GRIB_cfVarName :
- tp
- GRIB_dataType :
- fc
- GRIB_gridDefinitionDescription :
- Latitude/Longitude Grid
- GRIB_gridType :
- regular_ll
- GRIB_iDirectionIncrementInDegrees :
- 0.1
- GRIB_iScansNegatively :
- 0
- GRIB_jDirectionIncrementInDegrees :
- 0.1
- GRIB_jPointsAreConsecutive :
- 0
- GRIB_jScansPositively :
- 0
- GRIB_latitudeOfFirstGridPointInDegrees :
- 90.0
- GRIB_latitudeOfLastGridPointInDegrees :
- -57.1
- GRIB_longitudeOfFirstGridPointInDegrees :
- 0.0
- GRIB_longitudeOfLastGridPointInDegrees :
- 359.9
- GRIB_missingValue :
- 3.4028234663852886e+38
- GRIB_name :
- Total precipitation
- GRIB_numberOfPoints :
- 5299200
- GRIB_paramId :
- 228
- GRIB_shortName :
- tp
- GRIB_stepType :
- accum
- GRIB_stepUnits :
- 1
- GRIB_totalNumber :
- 0
- GRIB_typeOfLevel :
- surface
- GRIB_units :
- m
- long_name :
- Total precipitation
- standard_name :
- unknown
- units :
- m
Array Chunk Bytes 12.90 TiB 45.00 MiB Shape (669096, 1472, 3600) (2880, 64, 64) Dask graph 305463 chunks in 2 graph layers Data type float32 numpy.ndarray - tsn(valid_time, latitude, longitude)float32dask.array<chunksize=(2880, 64, 64), meta=np.ndarray>
- GRIB_NV :
- 0
- GRIB_Nx :
- 3600
- GRIB_Ny :
- 1472
- GRIB_cfName :
- temperature_in_surface_snow
- GRIB_cfVarName :
- tsn
- GRIB_dataType :
- an
- GRIB_gridDefinitionDescription :
- Latitude/Longitude Grid
- GRIB_gridType :
- regular_ll
- GRIB_iDirectionIncrementInDegrees :
- 0.1
- GRIB_iScansNegatively :
- 0
- GRIB_jDirectionIncrementInDegrees :
- 0.1
- GRIB_jPointsAreConsecutive :
- 0
- GRIB_jScansPositively :
- 0
- GRIB_latitudeOfFirstGridPointInDegrees :
- 90.0
- GRIB_latitudeOfLastGridPointInDegrees :
- -57.1
- GRIB_longitudeOfFirstGridPointInDegrees :
- 0.0
- GRIB_longitudeOfLastGridPointInDegrees :
- 359.9
- GRIB_missingValue :
- 3.4028234663852886e+38
- GRIB_name :
- Temperature of snow layer
- GRIB_numberOfPoints :
- 5299200
- GRIB_paramId :
- 238
- GRIB_shortName :
- tsn
- GRIB_stepType :
- instant
- GRIB_stepUnits :
- 1
- GRIB_totalNumber :
- 0
- GRIB_typeOfLevel :
- surface
- GRIB_units :
- K
- long_name :
- Temperature of snow layer
- standard_name :
- temperature_in_surface_snow
- units :
- K
Array Chunk Bytes 12.90 TiB 45.00 MiB Shape (669096, 1472, 3600) (2880, 64, 64) Dask graph 305463 chunks in 2 graph layers Data type float32 numpy.ndarray - u10(valid_time, latitude, longitude)float32dask.array<chunksize=(2880, 64, 64), meta=np.ndarray>
- GRIB_NV :
- 0
- GRIB_Nx :
- 3600
- GRIB_Ny :
- 1472
- GRIB_cfName :
- unknown
- GRIB_cfVarName :
- u10
- GRIB_dataType :
- fc
- GRIB_gridDefinitionDescription :
- Latitude/Longitude Grid
- GRIB_gridType :
- regular_ll
- GRIB_iDirectionIncrementInDegrees :
- 0.1
- GRIB_iScansNegatively :
- 0
- GRIB_jDirectionIncrementInDegrees :
- 0.1
- GRIB_jPointsAreConsecutive :
- 0
- GRIB_jScansPositively :
- 0
- GRIB_latitudeOfFirstGridPointInDegrees :
- 90.0
- GRIB_latitudeOfLastGridPointInDegrees :
- -57.1
- GRIB_longitudeOfFirstGridPointInDegrees :
- 0.0
- GRIB_longitudeOfLastGridPointInDegrees :
- 359.9
- GRIB_missingValue :
- 3.4028234663852886e+38
- GRIB_name :
- 10 metre U wind component
- GRIB_numberOfPoints :
- 5299200
- GRIB_paramId :
- 165
- GRIB_shortName :
- 10u
- GRIB_stepType :
- instant
- GRIB_stepUnits :
- 1
- GRIB_totalNumber :
- 0
- GRIB_typeOfLevel :
- surface
- GRIB_units :
- m s**-1
- long_name :
- 10 metre U wind component
- standard_name :
- unknown
- units :
- m s**-1
Array Chunk Bytes 12.90 TiB 45.00 MiB Shape (669096, 1472, 3600) (2880, 64, 64) Dask graph 305463 chunks in 2 graph layers Data type float32 numpy.ndarray - v10(valid_time, latitude, longitude)float32dask.array<chunksize=(2880, 64, 64), meta=np.ndarray>
- GRIB_NV :
- 0
- GRIB_Nx :
- 3600
- GRIB_Ny :
- 1472
- GRIB_cfName :
- unknown
- GRIB_cfVarName :
- v10
- GRIB_dataType :
- fc
- GRIB_gridDefinitionDescription :
- Latitude/Longitude Grid
- GRIB_gridType :
- regular_ll
- GRIB_iDirectionIncrementInDegrees :
- 0.1
- GRIB_iScansNegatively :
- 0
- GRIB_jDirectionIncrementInDegrees :
- 0.1
- GRIB_jPointsAreConsecutive :
- 0
- GRIB_jScansPositively :
- 0
- GRIB_latitudeOfFirstGridPointInDegrees :
- 90.0
- GRIB_latitudeOfLastGridPointInDegrees :
- -57.1
- GRIB_longitudeOfFirstGridPointInDegrees :
- 0.0
- GRIB_longitudeOfLastGridPointInDegrees :
- 359.9
- GRIB_missingValue :
- 3.4028234663852886e+38
- GRIB_name :
- 10 metre V wind component
- GRIB_numberOfPoints :
- 5299200
- GRIB_paramId :
- 166
- GRIB_shortName :
- 10v
- GRIB_stepType :
- instant
- GRIB_stepUnits :
- 1
- GRIB_totalNumber :
- 0
- GRIB_typeOfLevel :
- surface
- GRIB_units :
- m s**-1
- long_name :
- 10 metre V wind component
- standard_name :
- unknown
- units :
- m s**-1
Array Chunk Bytes 12.90 TiB 45.00 MiB Shape (669096, 1472, 3600) (2880, 64, 64) Dask graph 305463 chunks in 2 graph layers Data type float32 numpy.ndarray
- Conventions :
- CF-1.7
- GRIB_centre :
- ecmf
- GRIB_centreDescription :
- European Centre for Medium-Range Weather Forecasts
- GRIB_edition :
- 1
- GRIB_subCentre :
- 0
- history :
- 2024-10-29T11:44 GRIB to CDM+CF via cfgrib-0.9.14.1/ecCodes-2.38.0 with {"source": ".xarray-ecmwf-cache/6bddab5961062f8a43d6014732137376.grib", "filter_by_keys": {}, "encode_cf": ["parameter", "time", "geography", "vertical"]}
- institution :
- European Centre for Medium-Range Weather Forecasts
⚠ At this point, no data has been downloaded yet, nor loaded in memory.
Storm Daniel precipitation (6-7 September 2023) vs average September precipitation (1993-2022)#
2. Data selection#
First, we perform a geographical selection corresponding to the Greece area:
[ ]:
xr.set_options(keep_attrs=True)

tp = ds.tp
tp_greece = tp.sel(**{"latitude": slice(41, 34), "longitude": slice(19, 28)})
tp_greece
<xarray.DataArray 'tp' (valid_time: 669096, latitude: 70, longitude: 90)> Size: 17GB
dask.array<getitem, shape=(669096, 70, 90), dtype=float32, chunksize=(2880, 49, 64), chunktype=numpy.ndarray>
Coordinates:
  * valid_time           (valid_time) datetime64[ns] 5MB 1950-01-01 ... 2026-...
  * latitude             (latitude) float64 560B 40.9 40.8 40.7 ... 34.1 34.0
  * longitude            (longitude) float64 720B 19.0 19.1 19.2 ... 27.8 27.9
    depthBelowLandLayer  float64 8B ...
    number               int64 8B ...
    surface              float64 8B ...
Attributes: (12/30)
    GRIB_NV:                                  0
    GRIB_Nx:                                  3600
    GRIB_Ny:                                  1472
    GRIB_cfName:                              unknown
    GRIB_cfVarName:                           tp
    GRIB_dataType:                            fc
    ...                                       ...
    GRIB_totalNumber:                         0
    GRIB_typeOfLevel:                         surface
    GRIB_units:                               m
    long_name:                                Total precipitation
    standard_name:                            unknown
units: m- valid_time: 669096
- latitude: 70
- longitude: 90
- dask.array<chunksize=(2880, 21, 2), meta=np.ndarray>
Array Chunk Bytes 15.70 GiB 34.45 MiB Shape (669096, 70, 90) (2880, 49, 64) Dask graph 1398 chunks in 3 graph layers Data type float32 numpy.ndarray - valid_time(valid_time)datetime64[ns]1950-01-01 ... 2026-04-30T23:00:00
array(['1950-01-01T00:00:00.000000000', '1950-01-01T01:00:00.000000000', '1950-01-01T02:00:00.000000000', ..., '2026-04-30T21:00:00.000000000', '2026-04-30T22:00:00.000000000', '2026-04-30T23:00:00.000000000'], shape=(669096,), dtype='datetime64[ns]') - latitude(latitude)float6440.9 40.8 40.7 ... 34.2 34.1 34.0
- long_name :
- latitude
- standard_name :
- latitude
- stored_direction :
- decreasing
- units :
- degrees_north
array([40.9, 40.8, 40.7, 40.6, 40.5, 40.4, 40.3, 40.2, 40.1, 40. , 39.9, 39.8, 39.7, 39.6, 39.5, 39.4, 39.3, 39.2, 39.1, 39. , 38.9, 38.8, 38.7, 38.6, 38.5, 38.4, 38.3, 38.2, 38.1, 38. , 37.9, 37.8, 37.7, 37.6, 37.5, 37.4, 37.3, 37.2, 37.1, 37. , 36.9, 36.8, 36.7, 36.6, 36.5, 36.4, 36.3, 36.2, 36.1, 36. , 35.9, 35.8, 35.7, 35.6, 35.5, 35.4, 35.3, 35.2, 35.1, 35. , 34.9, 34.8, 34.7, 34.6, 34.5, 34.4, 34.3, 34.2, 34.1, 34. ]) - longitude(longitude)float6419.0 19.1 19.2 ... 27.7 27.8 27.9
- long_name :
- longitude
- standard_name :
- longitude
- units :
- degrees_east
array([19. , 19.1, 19.2, 19.3, 19.4, 19.5, 19.6, 19.7, 19.8, 19.9, 20. , 20.1, 20.2, 20.3, 20.4, 20.5, 20.6, 20.7, 20.8, 20.9, 21. , 21.1, 21.2, 21.3, 21.4, 21.5, 21.6, 21.7, 21.8, 21.9, 22. , 22.1, 22.2, 22.3, 22.4, 22.5, 22.6, 22.7, 22.8, 22.9, 23. , 23.1, 23.2, 23.3, 23.4, 23.5, 23.6, 23.7, 23.8, 23.9, 24. , 24.1, 24.2, 24.3, 24.4, 24.5, 24.6, 24.7, 24.8, 24.9, 25. , 25.1, 25.2, 25.3, 25.4, 25.5, 25.6, 25.7, 25.8, 25.9, 26. , 26.1, 26.2, 26.3, 26.4, 26.5, 26.6, 26.7, 26.8, 26.9, 27. , 27.1, 27.2, 27.3, 27.4, 27.5, 27.6, 27.7, 27.8, 27.9]) - depthBelowLandLayer()float64...
- long_name :
- soil depth
- positive :
- down
- standard_name :
- depth
- units :
- m
[1 values with dtype=float64]
- number()int64...
- long_name :
- ensemble member numerical id
- standard_name :
- realization
- units :
- 1
[1 values with dtype=int64]
- surface()float64...
- long_name :
- original GRIB coordinate for key: level(surface)
- units :
- 1
[1 values with dtype=float64]
- GRIB_NV :
- 0
- GRIB_Nx :
- 3600
- GRIB_Ny :
- 1472
- GRIB_cfName :
- unknown
- GRIB_cfVarName :
- tp
- GRIB_dataType :
- fc
- GRIB_gridDefinitionDescription :
- Latitude/Longitude Grid
- GRIB_gridType :
- regular_ll
- GRIB_iDirectionIncrementInDegrees :
- 0.1
- GRIB_iScansNegatively :
- 0
- GRIB_jDirectionIncrementInDegrees :
- 0.1
- GRIB_jPointsAreConsecutive :
- 0
- GRIB_jScansPositively :
- 0
- GRIB_latitudeOfFirstGridPointInDegrees :
- 90.0
- GRIB_latitudeOfLastGridPointInDegrees :
- -57.1
- GRIB_longitudeOfFirstGridPointInDegrees :
- 0.0
- GRIB_longitudeOfLastGridPointInDegrees :
- 359.9
- GRIB_missingValue :
- 3.4028234663852886e+38
- GRIB_name :
- Total precipitation
- GRIB_numberOfPoints :
- 5299200
- GRIB_paramId :
- 228
- GRIB_shortName :
- tp
- GRIB_stepType :
- accum
- GRIB_stepUnits :
- 1
- GRIB_totalNumber :
- 0
- GRIB_typeOfLevel :
- surface
- GRIB_units :
- m
- long_name :
- Total precipitation
- standard_name :
- unknown
- units :
- m
Then, we select only the data belonging to the month of September for the 1993-2023 time period (30 years). We will use this to extract the Storm Daniel event and the 1993-2022 September mean.
[ ]:
tp_greece_september = tp_greece[tp_greece.valid_time.dt.month.isin([9])]
tp_greece_september_1993_2023 = tp_greece_september.sel(valid_time=slice('1993', '2023'))
tp_greece_september_1993_2023
<xarray.DataArray 'tp' (valid_time: 22320, latitude: 70, longitude: 90)> Size: 562MB
dask.array<getitem, shape=(22320, 70, 90), dtype=float32, chunksize=(2871, 49, 64), chunktype=numpy.ndarray>
Coordinates:
  * valid_time           (valid_time) datetime64[ns] 179kB 1993-09-01 ... 202...
  * latitude             (latitude) float64 560B 40.9 40.8 40.7 ... 34.1 34.0
  * longitude            (longitude) float64 720B 19.0 19.1 19.2 ... 27.8 27.9
    depthBelowLandLayer  float64 8B ...
    number               int64 8B ...
    surface              float64 8B ...
Attributes: (12/30)
    GRIB_NV:                                  0
    GRIB_Nx:                                  3600
    GRIB_Ny:                                  1472
    GRIB_cfName:                              unknown
    GRIB_cfVarName:                           tp
    GRIB_dataType:                            fc
    ...                                       ...
    GRIB_totalNumber:                         0
    GRIB_typeOfLevel:                         surface
    GRIB_units:                               m
    long_name:                                Total precipitation
    standard_name:                            unknown
units: m- valid_time: 22320
- latitude: 70
- longitude: 90
- dask.array<chunksize=(621, 21, 2), meta=np.ndarray>
Array Chunk Bytes 536.41 MiB 34.35 MiB Shape (22320, 70, 90) (2871, 49, 64) Dask graph 54 chunks in 5 graph layers Data type float32 numpy.ndarray - valid_time(valid_time)datetime64[ns]1993-09-01 ... 2023-09-30T23:00:00
array(['1993-09-01T00:00:00.000000000', '1993-09-01T01:00:00.000000000', '1993-09-01T02:00:00.000000000', ..., '2023-09-30T21:00:00.000000000', '2023-09-30T22:00:00.000000000', '2023-09-30T23:00:00.000000000'], shape=(22320,), dtype='datetime64[ns]') - latitude(latitude)float6440.9 40.8 40.7 ... 34.2 34.1 34.0
- long_name :
- latitude
- standard_name :
- latitude
- stored_direction :
- decreasing
- units :
- degrees_north
array([40.9, 40.8, 40.7, 40.6, 40.5, 40.4, 40.3, 40.2, 40.1, 40. , 39.9, 39.8, 39.7, 39.6, 39.5, 39.4, 39.3, 39.2, 39.1, 39. , 38.9, 38.8, 38.7, 38.6, 38.5, 38.4, 38.3, 38.2, 38.1, 38. , 37.9, 37.8, 37.7, 37.6, 37.5, 37.4, 37.3, 37.2, 37.1, 37. , 36.9, 36.8, 36.7, 36.6, 36.5, 36.4, 36.3, 36.2, 36.1, 36. , 35.9, 35.8, 35.7, 35.6, 35.5, 35.4, 35.3, 35.2, 35.1, 35. , 34.9, 34.8, 34.7, 34.6, 34.5, 34.4, 34.3, 34.2, 34.1, 34. ]) - longitude(longitude)float6419.0 19.1 19.2 ... 27.7 27.8 27.9
- long_name :
- longitude
- standard_name :
- longitude
- units :
- degrees_east
array([19. , 19.1, 19.2, 19.3, 19.4, 19.5, 19.6, 19.7, 19.8, 19.9, 20. , 20.1, 20.2, 20.3, 20.4, 20.5, 20.6, 20.7, 20.8, 20.9, 21. , 21.1, 21.2, 21.3, 21.4, 21.5, 21.6, 21.7, 21.8, 21.9, 22. , 22.1, 22.2, 22.3, 22.4, 22.5, 22.6, 22.7, 22.8, 22.9, 23. , 23.1, 23.2, 23.3, 23.4, 23.5, 23.6, 23.7, 23.8, 23.9, 24. , 24.1, 24.2, 24.3, 24.4, 24.5, 24.6, 24.7, 24.8, 24.9, 25. , 25.1, 25.2, 25.3, 25.4, 25.5, 25.6, 25.7, 25.8, 25.9, 26. , 26.1, 26.2, 26.3, 26.4, 26.5, 26.6, 26.7, 26.8, 26.9, 27. , 27.1, 27.2, 27.3, 27.4, 27.5, 27.6, 27.7, 27.8, 27.9]) - depthBelowLandLayer()float64...
- long_name :
- soil depth
- positive :
- down
- standard_name :
- depth
- units :
- m
[1 values with dtype=float64]
- number()int64...
- long_name :
- ensemble member numerical id
- standard_name :
- realization
- units :
- 1
[1 values with dtype=int64]
- surface()float64...
- long_name :
- original GRIB coordinate for key: level(surface)
- units :
- 1
[1 values with dtype=float64]
- GRIB_NV :
- 0
- GRIB_Nx :
- 3600
- GRIB_Ny :
- 1472
- GRIB_cfName :
- unknown
- GRIB_cfVarName :
- tp
- GRIB_dataType :
- fc
- GRIB_gridDefinitionDescription :
- Latitude/Longitude Grid
- GRIB_gridType :
- regular_ll
- GRIB_iDirectionIncrementInDegrees :
- 0.1
- GRIB_iScansNegatively :
- 0
- GRIB_jDirectionIncrementInDegrees :
- 0.1
- GRIB_jPointsAreConsecutive :
- 0
- GRIB_jScansPositively :
- 0
- GRIB_latitudeOfFirstGridPointInDegrees :
- 90.0
- GRIB_latitudeOfLastGridPointInDegrees :
- -57.1
- GRIB_longitudeOfFirstGridPointInDegrees :
- 0.0
- GRIB_longitudeOfLastGridPointInDegrees :
- 359.9
- GRIB_missingValue :
- 3.4028234663852886e+38
- GRIB_name :
- Total precipitation
- GRIB_numberOfPoints :
- 5299200
- GRIB_paramId :
- 228
- GRIB_shortName :
- tp
- GRIB_stepType :
- accum
- GRIB_stepUnits :
- 1
- GRIB_totalNumber :
- 0
- GRIB_typeOfLevel :
- surface
- GRIB_units :
- m
- long_name :
- Total precipitation
- standard_name :
- unknown
- units :
- m
At this point, the data should be small enough to fit in memory. We can check the size of it with the costing.py module:
[ ]:
import costing

costing.estimate_download_size(tp_greece_september_1993_2023)
Estimated download size: 0.475 GiB (486.0 MiB)
3. Data download#
This is the phase where we explicitly trigger the download of the data. Remember to assign the return of the compute() function to a new variable, so that the data is kept in memory.
We can measure the time it takes:
[ ]:
%%time

tp_greece_september_1993_2023_computed = tp_greece_september_1993_2023.compute()
CPU times: user 26.1 s, sys: 15.8 s, total: 41.9 s
Wall time: 46.6 s
4. Data reduction#
With the data loaded in memory we can easily compute the total precipitation for the Storm Daniel event. Notice that for each day of the year the total daily precipitation is given at T00:00:00.
[ ]:
tp_greece_storm_daniel = tp_greece_september_1993_2023_computed.sel(valid_time=["2023-09-06", "2023-09-07"]).sum("valid_time") # only takes the data at T00:00:00 timestamps
tp_greece_storm_daniel
<xarray.DataArray 'tp' (latitude: 70, longitude: 90)> Size: 25kB
array([[0., 0., 0., ..., 0., 0., 0.],
       [0., 0., 0., ..., 0., 0., 0.],
       [0., 0., 0., ..., 0., 0., 0.],
       ...,
       [0., 0., 0., ..., 0., 0., 0.],
       [0., 0., 0., ..., 0., 0., 0.],
       [0., 0., 0., ..., 0., 0., 0.]], shape=(70, 90), dtype=float32)
Coordinates:
  * latitude             (latitude) float64 560B 40.9 40.8 40.7 ... 34.1 34.0
  * longitude            (longitude) float64 720B 19.0 19.1 19.2 ... 27.8 27.9
    depthBelowLandLayer  float64 8B 100.0
    number               int64 8B 0
    surface              float64 8B 0.0
Attributes: (12/30)
    GRIB_NV:                                  0
    GRIB_Nx:                                  3600
    GRIB_Ny:                                  1472
    GRIB_cfName:                              unknown
    GRIB_cfVarName:                           tp
    GRIB_dataType:                            fc
    ...                                       ...
    GRIB_totalNumber:                         0
    GRIB_typeOfLevel:                         surface
    GRIB_units:                               m
    long_name:                                Total precipitation
    standard_name:                            unknown
units: m- latitude: 70
- longitude: 90
- 0.0 0.0 0.0 0.0 5.838e-05 0.000126 ... 0.0 0.0 0.0 0.0 0.0 0.0
array([[0., 0., 0., ..., 0., 0., 0.], [0., 0., 0., ..., 0., 0., 0.], [0., 0., 0., ..., 0., 0., 0.], ..., [0., 0., 0., ..., 0., 0., 0.], [0., 0., 0., ..., 0., 0., 0.], [0., 0., 0., ..., 0., 0., 0.]], shape=(70, 90), dtype=float32) - latitude(latitude)float6440.9 40.8 40.7 ... 34.2 34.1 34.0
- long_name :
- latitude
- standard_name :
- latitude
- stored_direction :
- decreasing
- units :
- degrees_north
array([40.9, 40.8, 40.7, 40.6, 40.5, 40.4, 40.3, 40.2, 40.1, 40. , 39.9, 39.8, 39.7, 39.6, 39.5, 39.4, 39.3, 39.2, 39.1, 39. , 38.9, 38.8, 38.7, 38.6, 38.5, 38.4, 38.3, 38.2, 38.1, 38. , 37.9, 37.8, 37.7, 37.6, 37.5, 37.4, 37.3, 37.2, 37.1, 37. , 36.9, 36.8, 36.7, 36.6, 36.5, 36.4, 36.3, 36.2, 36.1, 36. , 35.9, 35.8, 35.7, 35.6, 35.5, 35.4, 35.3, 35.2, 35.1, 35. , 34.9, 34.8, 34.7, 34.6, 34.5, 34.4, 34.3, 34.2, 34.1, 34. ]) - longitude(longitude)float6419.0 19.1 19.2 ... 27.7 27.8 27.9
- long_name :
- longitude
- standard_name :
- longitude
- units :
- degrees_east
array([19. , 19.1, 19.2, 19.3, 19.4, 19.5, 19.6, 19.7, 19.8, 19.9, 20. , 20.1, 20.2, 20.3, 20.4, 20.5, 20.6, 20.7, 20.8, 20.9, 21. , 21.1, 21.2, 21.3, 21.4, 21.5, 21.6, 21.7, 21.8, 21.9, 22. , 22.1, 22.2, 22.3, 22.4, 22.5, 22.6, 22.7, 22.8, 22.9, 23. , 23.1, 23.2, 23.3, 23.4, 23.5, 23.6, 23.7, 23.8, 23.9, 24. , 24.1, 24.2, 24.3, 24.4, 24.5, 24.6, 24.7, 24.8, 24.9, 25. , 25.1, 25.2, 25.3, 25.4, 25.5, 25.6, 25.7, 25.8, 25.9, 26. , 26.1, 26.2, 26.3, 26.4, 26.5, 26.6, 26.7, 26.8, 26.9, 27. , 27.1, 27.2, 27.3, 27.4, 27.5, 27.6, 27.7, 27.8, 27.9]) - depthBelowLandLayer()float64100.0
- long_name :
- soil depth
- positive :
- down
- standard_name :
- depth
- units :
- m
array(100.)
- number()int640
- long_name :
- ensemble member numerical id
- standard_name :
- realization
- units :
- 1
array(0)
- surface()float640.0
- long_name :
- original GRIB coordinate for key: level(surface)
- units :
- 1
array(0.)
- GRIB_NV :
- 0
- GRIB_Nx :
- 3600
- GRIB_Ny :
- 1472
- GRIB_cfName :
- unknown
- GRIB_cfVarName :
- tp
- GRIB_dataType :
- fc
- GRIB_gridDefinitionDescription :
- Latitude/Longitude Grid
- GRIB_gridType :
- regular_ll
- GRIB_iDirectionIncrementInDegrees :
- 0.1
- GRIB_iScansNegatively :
- 0
- GRIB_jDirectionIncrementInDegrees :
- 0.1
- GRIB_jPointsAreConsecutive :
- 0
- GRIB_jScansPositively :
- 0
- GRIB_latitudeOfFirstGridPointInDegrees :
- 90.0
- GRIB_latitudeOfLastGridPointInDegrees :
- -57.1
- GRIB_longitudeOfFirstGridPointInDegrees :
- 0.0
- GRIB_longitudeOfLastGridPointInDegrees :
- 359.9
- GRIB_missingValue :
- 3.4028234663852886e+38
- GRIB_name :
- Total precipitation
- GRIB_numberOfPoints :
- 5299200
- GRIB_paramId :
- 228
- GRIB_shortName :
- tp
- GRIB_stepType :
- accum
- GRIB_stepUnits :
- 1
- GRIB_totalNumber :
- 0
- GRIB_typeOfLevel :
- surface
- GRIB_units :
- m
- long_name :
- Total precipitation
- standard_name :
- unknown
- units :
- m
5. Visualisation#
Finally, we can plot the Storm Daniel event on a map:
[ ]:
import display
import matplotlib.pyplot as plt
import cartopy.feature as cfeature

from cartopy import crs
[ ]:
tp_greece_storm_daniel_mm = tp_greece_storm_daniel * 1000 # convert to [mm]
tp_greece_storm_daniel_mm.attrs["units"] = "mm"


plt.style.use("bmh")

ax = display.map(
    tp_greece_storm_daniel_mm,
    projection=crs.Miller(),
    vmax=400,
    title="Storm Daniel total precipitation, 6-7 September 2023"
);

ax.gridlines(draw_labels=True, alpha = 0.2)
<cartopy.mpl.gridliner.Gridliner at 0x7ff46ed22c00>
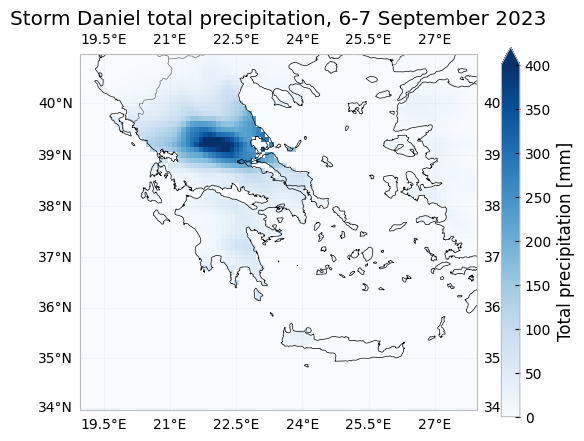
We want to compare the total precipitation observed during Storm Daniel with the average total precipitation observed in September between 1993 and 2023 (30 years). To do this we compute the 1993_2022 september mean:
[ ]:
tp_greece_september_1993_2022_mean_mm = 1000*tp_greece_september_1993_2023_computed[tp_greece_september_1993_2023_computed['valid_time'].dt.hour == 0].sel(valid_time=slice("1993", "2022")).sum("valid_time")/30
tp_greece_september_1993_2022_mean_mm
<xarray.DataArray 'tp' (latitude: 70, longitude: 90)> Size: 25kB
array([[0., 0., 0., ..., 0., 0., 0.],
       [0., 0., 0., ..., 0., 0., 0.],
       [0., 0., 0., ..., 0., 0., 0.],
       ...,
       [0., 0., 0., ..., 0., 0., 0.],
       [0., 0., 0., ..., 0., 0., 0.],
       [0., 0., 0., ..., 0., 0., 0.]], shape=(70, 90), dtype=float32)
Coordinates:
  * latitude             (latitude) float64 560B 40.9 40.8 40.7 ... 34.1 34.0
  * longitude            (longitude) float64 720B 19.0 19.1 19.2 ... 27.8 27.9
    depthBelowLandLayer  float64 8B 100.0
    number               int64 8B 0
    surface              float64 8B 0.0
Attributes: (12/30)
    GRIB_NV:                                  0
    GRIB_Nx:                                  3600
    GRIB_Ny:                                  1472
    GRIB_cfName:                              unknown
    GRIB_cfVarName:                           tp
    GRIB_dataType:                            fc
    ...                                       ...
    GRIB_totalNumber:                         0
    GRIB_typeOfLevel:                         surface
    GRIB_units:                               m
    long_name:                                Total precipitation
    standard_name:                            unknown
units: m- latitude: 70
- longitude: 90
- 0.0 0.0 0.0 0.0 88.14 86.63 84.66 ... 0.0 0.0 0.0 0.0 0.0 0.0 0.0
array([[0., 0., 0., ..., 0., 0., 0.], [0., 0., 0., ..., 0., 0., 0.], [0., 0., 0., ..., 0., 0., 0.], ..., [0., 0., 0., ..., 0., 0., 0.], [0., 0., 0., ..., 0., 0., 0.], [0., 0., 0., ..., 0., 0., 0.]], shape=(70, 90), dtype=float32) - latitude(latitude)float6440.9 40.8 40.7 ... 34.2 34.1 34.0
- long_name :
- latitude
- standard_name :
- latitude
- stored_direction :
- decreasing
- units :
- degrees_north
array([40.9, 40.8, 40.7, 40.6, 40.5, 40.4, 40.3, 40.2, 40.1, 40. , 39.9, 39.8, 39.7, 39.6, 39.5, 39.4, 39.3, 39.2, 39.1, 39. , 38.9, 38.8, 38.7, 38.6, 38.5, 38.4, 38.3, 38.2, 38.1, 38. , 37.9, 37.8, 37.7, 37.6, 37.5, 37.4, 37.3, 37.2, 37.1, 37. , 36.9, 36.8, 36.7, 36.6, 36.5, 36.4, 36.3, 36.2, 36.1, 36. , 35.9, 35.8, 35.7, 35.6, 35.5, 35.4, 35.3, 35.2, 35.1, 35. , 34.9, 34.8, 34.7, 34.6, 34.5, 34.4, 34.3, 34.2, 34.1, 34. ]) - longitude(longitude)float6419.0 19.1 19.2 ... 27.7 27.8 27.9
- long_name :
- longitude
- standard_name :
- longitude
- units :
- degrees_east
array([19. , 19.1, 19.2, 19.3, 19.4, 19.5, 19.6, 19.7, 19.8, 19.9, 20. , 20.1, 20.2, 20.3, 20.4, 20.5, 20.6, 20.7, 20.8, 20.9, 21. , 21.1, 21.2, 21.3, 21.4, 21.5, 21.6, 21.7, 21.8, 21.9, 22. , 22.1, 22.2, 22.3, 22.4, 22.5, 22.6, 22.7, 22.8, 22.9, 23. , 23.1, 23.2, 23.3, 23.4, 23.5, 23.6, 23.7, 23.8, 23.9, 24. , 24.1, 24.2, 24.3, 24.4, 24.5, 24.6, 24.7, 24.8, 24.9, 25. , 25.1, 25.2, 25.3, 25.4, 25.5, 25.6, 25.7, 25.8, 25.9, 26. , 26.1, 26.2, 26.3, 26.4, 26.5, 26.6, 26.7, 26.8, 26.9, 27. , 27.1, 27.2, 27.3, 27.4, 27.5, 27.6, 27.7, 27.8, 27.9]) - depthBelowLandLayer()float64100.0
- long_name :
- soil depth
- positive :
- down
- standard_name :
- depth
- units :
- m
array(100.)
- number()int640
- long_name :
- ensemble member numerical id
- standard_name :
- realization
- units :
- 1
array(0)
- surface()float640.0
- long_name :
- original GRIB coordinate for key: level(surface)
- units :
- 1
array(0.)
- GRIB_NV :
- 0
- GRIB_Nx :
- 3600
- GRIB_Ny :
- 1472
- GRIB_cfName :
- unknown
- GRIB_cfVarName :
- tp
- GRIB_dataType :
- fc
- GRIB_gridDefinitionDescription :
- Latitude/Longitude Grid
- GRIB_gridType :
- regular_ll
- GRIB_iDirectionIncrementInDegrees :
- 0.1
- GRIB_iScansNegatively :
- 0
- GRIB_jDirectionIncrementInDegrees :
- 0.1
- GRIB_jPointsAreConsecutive :
- 0
- GRIB_jScansPositively :
- 0
- GRIB_latitudeOfFirstGridPointInDegrees :
- 90.0
- GRIB_latitudeOfLastGridPointInDegrees :
- -57.1
- GRIB_longitudeOfFirstGridPointInDegrees :
- 0.0
- GRIB_longitudeOfLastGridPointInDegrees :
- 359.9
- GRIB_missingValue :
- 3.4028234663852886e+38
- GRIB_name :
- Total precipitation
- GRIB_numberOfPoints :
- 5299200
- GRIB_paramId :
- 228
- GRIB_shortName :
- tp
- GRIB_stepType :
- accum
- GRIB_stepUnits :
- 1
- GRIB_totalNumber :
- 0
- GRIB_typeOfLevel :
- surface
- GRIB_units :
- m
- long_name :
- Total precipitation
- standard_name :
- unknown
- units :
- m
Finally, we can plot the Storm Daniel event and the average September 1993-2022 precipitation side by side:
[ ]:
axs = display.maps(
    [tp_greece_storm_daniel_mm, tp_greece_september_1993_2022_mean_mm],
    projection=crs.Miller(),
    vmax=400,
    axs_set=[
        {"title": "Storm Daniel precipitation, 6-7 September 2023"},
        {"title": "Average September precipitation, 1993-2022"},
    ],
)

for ax in axs:
    ax.gridlines(draw_labels=True, alpha = 0.2)
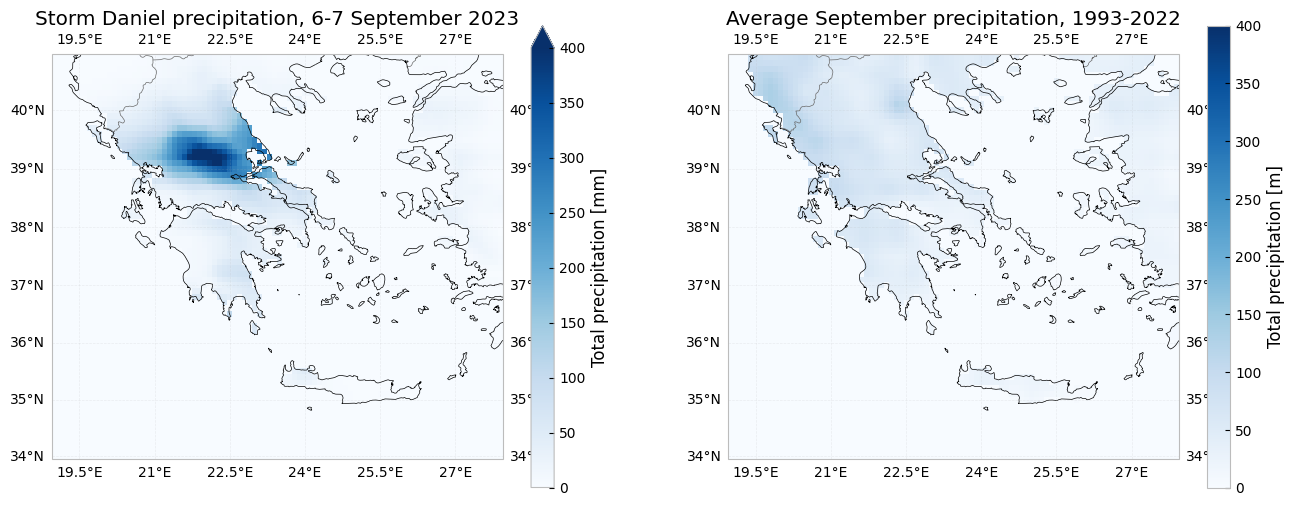
Accumulated precipitation: 2023 vs 1993-2022#
In this section we will compare the accumulated 2023 precipitation on an specific inland location (39.25 N, 21.9 E) with the accumulated precipitation of each year between 1993 and 2022 in the same location. We will also highlight the 1993-2022 accumulated mean. We follow the same logic as before for selecting the data, estimating the download cost, computing the selection and plotting the result.
[ ]:
tp_greece_inland_1993_2023 = ds.tp.sel(**{"latitude": 39.25, "longitude": 21.90, "method": "nearest"}).sel(valid_time=slice("1993", "2023"))
tp_greece_inland_1993_2023
<xarray.DataArray 'tp' (valid_time: 271728)> Size: 1MB
dask.array<getitem, shape=(271728,), dtype=float32, chunksize=(2880,), chunktype=numpy.ndarray>
Coordinates:
  * valid_time           (valid_time) datetime64[ns] 2MB 1993-01-01 ... 2023-...
    depthBelowLandLayer  float64 8B ...
    latitude             float64 8B 39.2
    longitude            float64 8B 21.9
    number               int64 8B ...
    surface              float64 8B ...
Attributes: (12/30)
    GRIB_NV:                                  0
    GRIB_Nx:                                  3600
    GRIB_Ny:                                  1472
    GRIB_cfName:                              unknown
    GRIB_cfVarName:                           tp
    GRIB_dataType:                            fc
    ...                                       ...
    GRIB_totalNumber:                         0
    GRIB_typeOfLevel:                         surface
    GRIB_units:                               m
    long_name:                                Total precipitation
    standard_name:                            unknown
units: m- valid_time: 271728
- dask.array<chunksize=(336,), meta=np.ndarray>
Array Chunk Bytes 1.04 MiB 11.25 kiB Shape (271728,) (2880,) Dask graph 96 chunks in 4 graph layers Data type float32 numpy.ndarray - valid_time(valid_time)datetime64[ns]1993-01-01 ... 2023-12-31T23:00:00
array(['1993-01-01T00:00:00.000000000', '1993-01-01T01:00:00.000000000', '1993-01-01T02:00:00.000000000', ..., '2023-12-31T21:00:00.000000000', '2023-12-31T22:00:00.000000000', '2023-12-31T23:00:00.000000000'], shape=(271728,), dtype='datetime64[ns]') - depthBelowLandLayer()float64...
- long_name :
- soil depth
- positive :
- down
- standard_name :
- depth
- units :
- m
[1 values with dtype=float64]
- latitude()float6439.2
- long_name :
- latitude
- standard_name :
- latitude
- stored_direction :
- decreasing
- units :
- degrees_north
array(39.2)
- longitude()float6421.9
- long_name :
- longitude
- standard_name :
- longitude
- units :
- degrees_east
array(21.9)
- number()int64...
- long_name :
- ensemble member numerical id
- standard_name :
- realization
- units :
- 1
[1 values with dtype=int64]
- surface()float64...
- long_name :
- original GRIB coordinate for key: level(surface)
- units :
- 1
[1 values with dtype=float64]
- GRIB_NV :
- 0
- GRIB_Nx :
- 3600
- GRIB_Ny :
- 1472
- GRIB_cfName :
- unknown
- GRIB_cfVarName :
- tp
- GRIB_dataType :
- fc
- GRIB_gridDefinitionDescription :
- Latitude/Longitude Grid
- GRIB_gridType :
- regular_ll
- GRIB_iDirectionIncrementInDegrees :
- 0.1
- GRIB_iScansNegatively :
- 0
- GRIB_jDirectionIncrementInDegrees :
- 0.1
- GRIB_jPointsAreConsecutive :
- 0
- GRIB_jScansPositively :
- 0
- GRIB_latitudeOfFirstGridPointInDegrees :
- 90.0
- GRIB_latitudeOfLastGridPointInDegrees :
- -57.1
- GRIB_longitudeOfFirstGridPointInDegrees :
- 0.0
- GRIB_longitudeOfLastGridPointInDegrees :
- 359.9
- GRIB_missingValue :
- 3.4028234663852886e+38
- GRIB_name :
- Total precipitation
- GRIB_numberOfPoints :
- 5299200
- GRIB_paramId :
- 228
- GRIB_shortName :
- tp
- GRIB_stepType :
- accum
- GRIB_stepUnits :
- 1
- GRIB_totalNumber :
- 0
- GRIB_typeOfLevel :
- surface
- GRIB_units :
- m
- long_name :
- Total precipitation
- standard_name :
- unknown
- units :
- m
[ ]:
import costing

costing.estimate_download_size(tp_greece_inland_1993_2023)
Estimated download size: 0.844 GiB (864.0 MiB)
[ ]:
%%time

tp_greece_inland_1993_2023_computed = tp_greece_inland_1993_2023.compute()
CPU times: user 10.5 s, sys: 5.18 s, total: 15.6 s
Wall time: 10.8 s
Now that the data is loaded in memory, we can easily extract the precipitation values for each year:
[ ]:
import datetime
tp_greece_inland_2023 = tp_greece_inland_1993_2023_computed[tp_greece_inland_1993_2023_computed['valid_time'].dt.hour == 0].sel(valid_time="2023")
tp_greece_inland_1993_2022 = tp_greece_inland_1993_2023_computed[tp_greece_inland_1993_2023_computed['valid_time'].dt.hour == 0].sel(valid_time=slice("1993", "2022"))
[ ]:
%load_ext autoreload
%autoreload 2
Using the display.compare() method we can plot the accumulated precipitation for all the years between 1993 and 2023, highlighting the \(10^{th}\), \(50^{th}\), \(90^{th}\) percentiles and the 2023 data.
[ ]:
plt.style.use('fivethirtyeight')
ax = display.compare(
    tp_greece_inland_2023,
    tp_greece_inland_1993_2022,
    time="valid_time",
    ylim=[-100, 1750],
)
ax.set_title('Accumulated precipitation [mm], Greece (39.25 N, 21.90 E)',  loc='left', fontsize = 14)
plt.legend(['10$^{th}$ percetile', '90$^{th}$ percetile', '50$^{th}$ percetile', '2023'],  prop={'size': 10});